
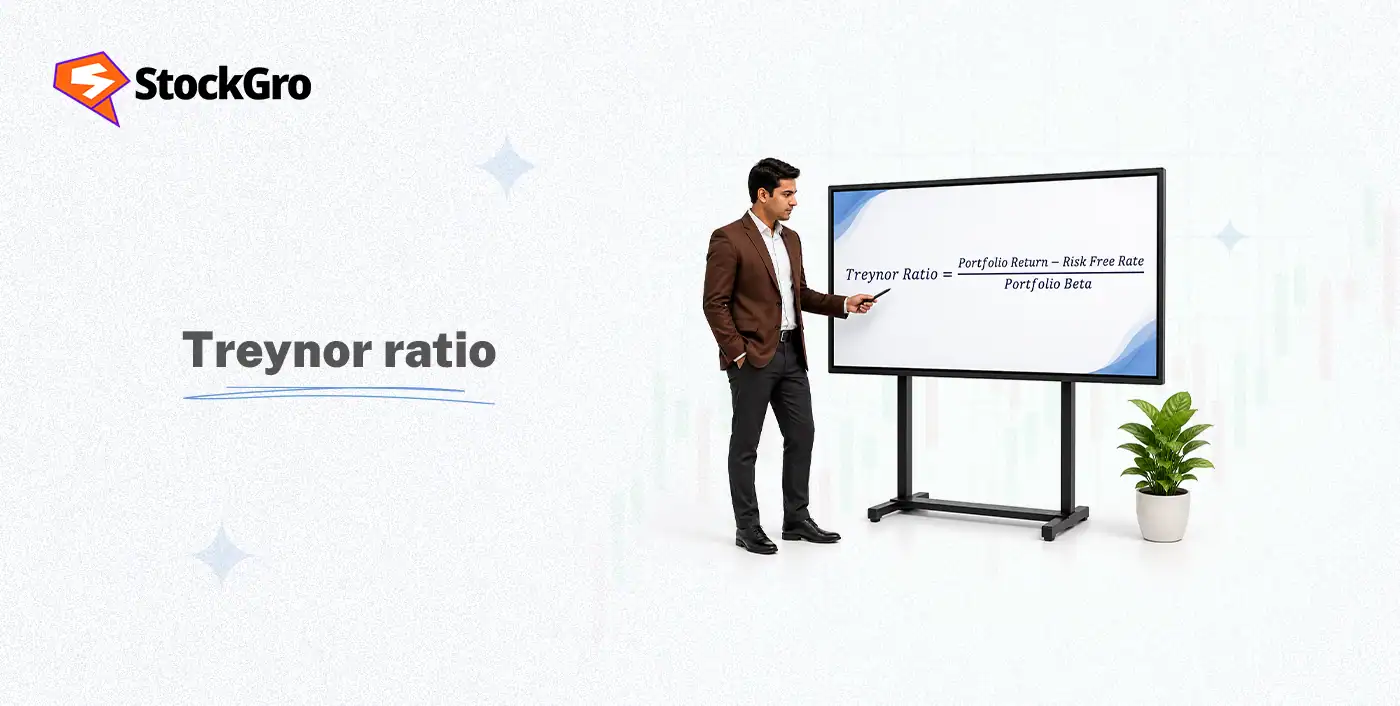
What is Treynor Ratio?
The Treynor ratio is a risk-adjusted performance measure used to evaluate how much excess return a portfolio generates for every unit of systematic risk undertaken.
It is also commonly named as the reward-to-volatility ratio and forms an important part of the overall types of ratio analysis used in portfolio evaluation and risk management.
In this context, excess return represents the return earned above the return available from a risk-free investment. While a completely risk-free investment does not practically exist, Treasury bills are generally considered the standard benchmark for calculating the risk-free rate in the Treynor ratio.
The risk component in the Treynor ratio is measured through beta, which represents systematic market risk. Beta indicates the degree to which a portfolio’s returns are expected to fluctuate in response to movements in the overall market.
Formula of Treynor Ratio and How It Works
The Treynor ratio evaluates how efficiently a portfolio converts market risk into excess returns. In portfolio analysis, it functions rather like a strict evaluator, marking not only the final answer, but also the level of risk taken to arrive there.
Formula for the Treynor Ratio:
| Treynor Ratio = (rp − rf) / βp |
Where:
rp: Portfolio return
rf: Risk-free rate
βp: Beta of the portfolio
How the Treynor Ratio Works?
- Measures excess reward: The ratio calculates how much return a portfolio earns above the risk-free rate for the market risk undertaken.
- Uses beta as the benchmark: The risk is measured through beta, which reflects how strongly the portfolio responds to movements in the share market.
- Evaluates portfolio efficiency: A higher Treynor generally indicates that the portfolio delivered stronger returns relative to systematic risk.
- Focuses on unavoidable market risk: The ratio is built on the principle that diversification can reduce company-specific risk, but systematic market risk continues to be a part of investing.
Example of Treynor Ratio in Real Investing Scenarios
Suppose Ananya, a 27-year-old investor, is comparing two mutual funds, Fund A and Fund B.
Fund A is an aggressive equity fund, while Fund B is a balanced hybrid fund.
| Aspects | Fund A | Fund B |
| Annual Return % | 15 | 10 |
| Beta | 1.5 | 0.8 |
| Risk-free Return % | 3 | 3 |
| Treynor Calculation | (15% − 3%) / 1.5 | (10% − 3%) / 0.8 |
| Treynor Ratio | 8 | 8.75 |
Interpretation:
At first glance, Fund A appears superior because it delivers higher returns. However, the Treynor ratio introduces an additional layer of analysis by considering systematic market risk.
Although Fund A earns stronger returns, it also carries considerably higher market volatility through a larger beta. Fund B generates slightly lower returns, yet compensates investors more efficiently for the level of risk undertaken.
This example illustrates why investors and fund managers use the Treynor ratio in portfolio evaluation and investment decision-making. In investing, higher returns may capture attention first, but efficient risk-taking usually earns the better report card.
Treynor Ratio vs Sharpe Ratio vs Jensen’s Alpha
The three metrics, Treynor, Sharpe ratio, and Jensen’s Alpha, measure risk-adjusted performance, but they differ primarily in the types of risk they penalise and how they quantify returns.
| Basis of Comparison | Treynor Ratio | Sharpe Ratio | Jensen’s Alpha |
| What does it measure? | It measures excess return earned for systematic market risk | It measures excess return earned for total portfolio volatility | It measures abnormal return generated above expected market return |
| Risk variable used | Beta | Standard deviation | Beta and CAPM expected return |
| Focus area | Market-related risk | Overall portfolio risk | Portfolio manager’s outperformance |
| Best suited for | Well-diversified portfolios | All types of portfolios | Active fund performance analysis |
| Interpretation | A higher ratio indicates better risk-adjusted efficiency | A higher ratio indicates better return per unit of volatility | A positive 𝞪 suggests outperformance,and a negative 𝞪 suggests that the portfolio underperformed |
| Key limitation | It ignores unsystematic risk | It treats all volatility equally | It is dependent on CAPM assumptions |
Why Treynor Ratio Matters for Investors and Traders?
A portfolio delivering impressive returns may still raise an uncomfortable financial question: how much market risk was carried to achieve those gains? The Treynor ratio matters because it introduces this missing layer into investment analysis.
- Evaluates risk-adjusted efficiency: The ratio helps investors determine whether a portfolio is generating sufficient return for the level of systematic market risk undertaken.
- Improves portfolio comparison: For instance, two funds may deliver similar returns, yet the Treynor ratio reveals which portfolio used market risk more efficiently.
- Useful for diversified portfolios: Since the ratio focuses on systematic risk through beta, it is particularly valuable when analysing diversified mutual funds and professionally managed portfolios.
- Supports better investment decisions: Investors and traders can avoid selecting portfolios purely on higher returns and instead evaluate the quality of those returns relative to market volatility.
- Helps in fund performance analysis: Fund managers often use the Treynor ratio to assess whether portfolio strategies are producing adequate compensation for market-linked risk.
Limitations and Common Mistakes While Using the Treynor Ratio
Like most financial ratios, the Treynor ratio is useful when applied correctly and thoroughly confusing when treated as a magical shortcut for investment decisions.
While the metric helps evaluate risk-adjusted returns, it does carry certain limitations that investors must understand carefully.
- Ignoring unsystematic risk: The Treynor ratio considers only systematic market risk through beta. Investors sometimes forget that poorly diversified portfolios may still carry significant company-specific risk.
- Using unstable beta values: Beta changes over time with market movements and portfolio allocation shifts. Therefore, relying on outdated beta values can produce misleading conclusions.
- Comparing unrelated asset classes: Investors occasionally compare equity funds, debt funds, and hybrid portfolios directly using the Treynor ratio, even though their risk characteristics differ substantially.
- Treating higher ratios as automatic buy signals: A high Treynor ratio does not guarantee a superior investment. Factors such as liquidity, market conditions, investment horizon, and portfolio objectives still require separate evaluation.
- Depending entirely on historical data: The ratio is calculated using past returns and past market behaviour. The financial markets, unfortunately, possess little loyalty towards historical patterns and regularly invent fresh surprises.
How Beginners Can Use the Treynor Ratio to Build Better Portfolios?
In case you are a beginner, the Treynor ratio can serve as a practical checkpoint between attractive returns and excessive market risk.
Most new investors focus entirely on percentage gains, while this ratio questions whether those returns were earned efficiently or simply dragged uphill by higher volatility.
- Compare mutual funds more effectively: You can use the Treynor ratio to compare funds delivering similar returns and identify which portfolio managed market risk more efficiently.
- Avoid chasing high-return portfolios blindly: A portfolio showing exceptional returns may also carry an unusually high beta. The Treynor ratio helps investors examine whether the additional risk is justified.
- Understand the role of beta: Using the ratio introduces beginners to beta and systematic risk, both of which are important concepts in long-term portfolio management.
- Use it alongside other metrics: The Treynor ratio works best when combined with measures such as the Sharpe Ratio, expense ratio, and portfolio diversification rather than being used alone.
- Build balanced investment habits: Over time, the ratio encourages investors to think beyond headline returns and focus on consistency, efficiency, and disciplined risk management.
Conclusion
The Treynor ratio is an essential tool for evaluating portfolio efficiency, specifically by measuring excess returns against systematic market risk (beta). A higher ratio signifies better compensation for risk taken. It is especially useful for diversified portfolios and helps investors move beyond surface-level returns to focus on the quality and sustainability of their gains.
When used with other metrics like the Sharpe ratio, the Treynor ratio supports balanced, disciplined investment decision-making.
FAQs
Both Treynor and Sharpe ratios serve different purposes. The Treynor ratio measures returns against systematic market risk through beta, while the Sharpe ratio considers total portfolio volatility. The diversified portfolios often use the Treynor Ratio more effectively.
Yes, beginners can use the Treynor ratio to compare mutual funds and understand whether higher returns justify higher market risk. It helps investors focus on risk-adjusted performance rather than selecting investments purely based on returns alone.
Beta is the core risk measure used in the Treynor ratio. It represents a portfolio’s sensitivity to market movements. The ratio evaluates how much excess return a portfolio generates for each unit of systematic market risk measured through beta.
The Treynor ratio is commonly used in mutual fund analysis, portfolio management, and institutional investing. Fund managers and investors use it to compare diversified portfolios and evaluate whether returns adequately compensate for market-related investment risk.