Ratio analysis, the financial world’s secret decoder ring, unveils a company’s financial story like a well-kept secret. Ratio analysis is a pivotal financial evaluation tool that offers structured insights into a company’s fiscal health. It examines financial relationships, aiding stakeholders in making informed decisions.
Like Sherlock Holmes examines clues, it dissects numbers, revealing a company’s strengths, weaknesses, and future prospects.
Dive into the world of ratios, and you will unlock the hidden language of finance, making smarter financial decisions along the way.
What is ratio analysis?
Ratios are like measuring sticks for companies. Financial ratios provide a window into a company’s performance in comparison to the industry. They enable us to gauge whether a company’s current performance surpasses or lags behind its historical benchmarks.
It is also important to recognise the variables behind these ratios as the companies sometimes adjust their strategies to present favourable figures. So, understanding ratios and their derivations thoroughly help in assessing the company’s position accurately.
You may also like: Decoding the cash reserve ratio: Your guide to understanding banking reserves
Types of ratio analysis
- Liquidity ratios: These ratios assess a company’s capability to meet its immediate financial obligations using available cash or assets.
- Profitability ratios: These ratios indicate if a company is generating profits and how effectively it is doing so.
- Solvency ratios: These ratios measure a company’s capacity to manage its long-term debts and financial commitments.
- Efficiency ratios: These ratios help measure how efficiently a company utilises its resources.
- Market prospect ratios: Investors use these ratios to evaluate the attractiveness of a company’s stock.
Ratio analysis is like financial detective work. Each ratio offers a unique insight into a company’s financial status, aiding in well-informed decisions regarding investments or a company’s overall well-being.
These ratios serve as instruments to decipher a company’s financial narrative, helping to determine its attractiveness as an investment or business opportunity.
Characteristics of ratio analysis
- It helps us see how well a company manages its money.
- It is to check whether a company can pay off its debts.
- It shows if a company is making money and how efficiently.
- It helps investors decide if a stock is a good buy.
- It is a health checkup for businesses, telling us if they are in good shape.
Ratio analysis formulas
Liquidity ratios:
- Formula of Current Ratio: Current Assets (CA) ÷ Current Liabilities (CL)
- Formula of Quick Ratio (Acid-Test Ratio): (Current Assets – Inventory) ÷ Current Liabilities
Profitability ratios:
- Profit Margin Formula: (Net Profit ÷ Total Revenue) × 100
- Formula of Return on Assets or ROA : Net Profit ÷ Total Assets
- Formula of Return on Equity (ROE): Net Profit ÷ Shareholders’ Equity
Solvency ratios:
- Debt-to-Equity Ratio Formula: Total Debt ÷ Shareholders’ Equity
- Formula of Interest Coverage Ratio: EBIT or Earnings Before Interest and Taxes÷ Interest Expense
Efficiency ratios:
- Formula of Inventory Turnover COGS or Cost of Goods Sold ÷ Average Inventory
- Formula of Accounts Receivable Turnover: Total Revenue ÷ Average Accounts Receivable
Market-prospect ratios:
- Formula of Price-to-Earnings (P/E) Ratio: Market Price per Share ÷ Earnings per Share (EPS)
- Dividend Yield Formula: Dividends per Share ÷ Market Price per Share
Also Read: Understanding stock valuations using PEG ratio analysis
Uses of ratio analysis
Ratios are widely in use across the industry. Below are some significant applications of ratio analysis.
- Financial statement analysis – Financial statements are hard to comprehend as they are. But, upon calculating ratios on these numbers, the comparison and interpretation of the company’s financial position becomes easy.
- Aids in judging a company’s strengths and weaknesses – Ratios are critical in conveying the performance of companies.
For example, the PEG Ratio suggests a company’s growth; Debt-to-equity indicates the amount of debt and equity in a company’s capital. Similarly, there are various ratios available to judge companies across different parameters. - Ratios for comparison – The simplest way to compare companies with their past performance, industry standards and their competitors is through ratios. Ratios provide a birds-eye view of the company’s performance throughout the year. Analysing these ratios helps in measuring where a company stands in the industry among its competitors. It also suggests whether the company is growing well from the previous year.
- Ratios for investors – Ratios are critical in making investment decisions. For example, earnings per share and return on equity are two basic ratios used when an investor wants to decide on the most profitable stock.
Ratio analysis example
Explanation of Tata Motors’ ratios using the current market data:
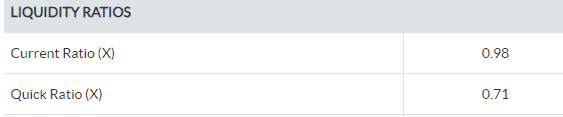
Current Ratio: Tata Motors currently has a current ratio of 0.98. While this ratio is slightly below 1, suggesting a relatively tight liquidity position, to assess industry norms for context.
Liquidity Ratio: With a quick ratio of 0.71, this ratio emphasises the company’s capacity to meet its liquid assets’ immediate financial needs.
Return on Net Worth/Equity: Tata Motors reports a return on net worth or equity of 5.32%. This figure indicates that the company earns approximately ₹0.0532 for every rupee of equity invested by the shareholder.
Return on Capital Employed: Tata Motors has a return on capital employed (ROCE) of 6.45%. ROCE demonstrates how efficiently the company utilises its capital to generate profits.
Also Read: The simplicity and enigma of debt to equity ratio
Bottomline
Amidst a deluge of data, companies utilise the methodologies of “accounting ratio analysis” and “financial ratio analysis” to gain clarity and direction.
These methods involve scrutinising various numerical aspects collectively to paint a comprehensive picture of their financial health.
Ratio analysis aids in assessing trends over time, benchmarking against industry peers, and achieving internal objectives. It’s a strategic tool for harnessing data intelligence to inform and enhance decision-making.