Healthcare in India is no longer just a defensive sector, it is a structural growth story. Rising lifestyle diseases, increasing insurance penetration, medical tourism, and premium healthcare demand are reshaping the industry.
At the center of this transformation stands Apollo Hospitals Enterprise Limited (AHEL), India’s most recognized private healthcare brand. From tertiary care hospitals to digital health platforms and pharmacy retail, Apollo has built an integrated healthcare ecosystem that few can replicate.
But does Apollo Hospitals Ltd. offer a compelling case for long-term investors? Let’s delve deeper.
Stock overview
| Ticker | APOLLOHOSP |
| Industry/Sector | Healthcare & Pharma |
| CMP | 7723.00 |
| Market Cap (₹ Cr.) | 1,11,023 |
| P/E | 60.27 (Vs Industry P/E of 58.35) |
| 52 W High/Low | 8099.50 / 6001.00 |
| EPS (TTM) | 129.76 |
| Dividend Yield | 0.16% |
About Apollo Hospitals Ltd.
Founded in 1983 by Dr. Prathap C. Reddy, Apollo Hospitals is one of India’s largest integrated healthcare providers. The company pioneered private healthcare in India and today operates across hospitals, pharmacies, diagnostics, and digital health.
With a strong brand, presence in metro and tier-2 cities, and growing digital integration through Apollo 24/7, the company has transitioned from a hospital operator to a healthcare platform.
Key business segments
Apollo Hospitals Ltd. operates primarily in the following key business segments:
- Hospitals: Multi-specialty tertiary and quaternary care hospitals across India.
- Pharmacies: One of India’s largest organized retail pharmacy networks.
- Diagnostics & Day Care: Lab services, preventive health checks, and ambulatory care.
- Digital Health (Apollo 24/7): Online consultations, e-pharmacy, and integrated digital healthcare ecosystem.
- International Operations: Select overseas hospital operations and medical tourism services.
Primary growth factors for Apollo Hospitals Ltd.
Apollo Hospitals Ltd. key growth drivers:
- Rising Healthcare Demand: Increasing chronic diseases and higher per capita healthcare spending.
- Insurance Penetration Growth: Expanding coverage improves affordability and patient volumes.
- Operating Leverage from Mature Hospitals: Margin expansion as occupancy stabilizes.
- Digital Ecosystem Integration: Apollo 24/7 enabling cross-selling and patient stickiness.
- Pharmacy Network Scale: Strong procurement power and retail expansion.
Detailed competition analysis for Apollo Hospitals Ltd.
Key financial metrics – TTM;
| Company | Sales (₹ Cr.) | EBITDA (₹ Cr.) | EBITDA Margin (%) | PAT (₹ Cr.) | PAT Margin (%) | P/E |
| Apollo Hospitals Ltd. | 24215.20 | 3528.00 | 14.57% | 1820.50 | 7.52% | 60.27 |
| Max Healthcare Ltd. | 8140.30 | 2148.02 | 26.39% | 1419.19 | 17.43% | 74.88 |
| Fortis Healthcare Ltd. | 8770.37 | 1988.12 | 22.67% | 966.25 | 11.02% | 72.53 |
| Narayana Hrudayalaya Ltd. | 6777.67 | 1464.41 | 21.61% | 782.25 | 11.54% | 48.08 |
| Aster DM Healthcare Ltd. | 4461.18 | 860.52 | 19.29% | 397.54 | 8.91% | 94.13 |
Key insights on Apollo Hospitals Ltd.
- Strong brand equity and first-mover advantage in Indian private healthcare.
- Improving EBITDA margins in mature hospital clusters.
- An integrated ecosystem improves patient lifetime value.
- Pharmacy and digital businesses provide recurring revenue streams.
- High entry barriers due to capital intensity and regulatory requirements.
Recent financial performance of Apollo Hospitals Ltd. for Q3 FY26
| Metric | Q3 FY25 | Q2 FY26 | Q3 FY26 | QoQ Growth (%) | YoY Growth (%) |
| Sales (₹ Cr.) | 5526.90 | 6303.50 | 6477.40 | 2.76% | 17.20% |
| EBITDA (₹ Cr.) | 761.50 | 941.10 | 965.30 | 2.57% | 26.76% |
| EBITDA Margin (%) | 13.78% | 14.93% | 14.90% | -3 bps | 112 bps |
| PAT (₹ Cr.) | 374.10 | 487.70 | 501.40 | 2.81% | 34.03% |
| PAT Margin (%) | 6.77% | 7.74% | 7.74% | 0 bps | 97 bps |
| Adjusted EPS (₹) | 25.89 | 33.19 | 34.93 | 5.24% | 34.92% |
Apollo Hospitals Ltd. financial update (Q3 FY26)
Financial performance
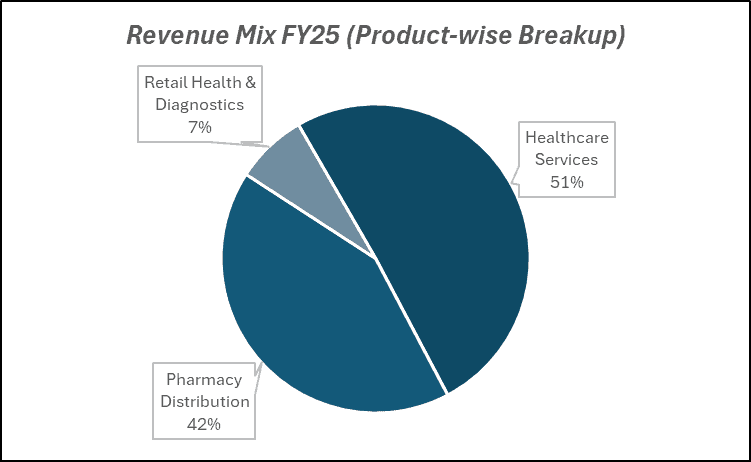
- Revenue grew 17% YoY to ₹6,477 Cr in Q3FY26, driven by broad-based growth across hospitals and HealthCo.
- EBITDA increased 27% YoY to ₹965 Cr; margins expanded 112 bps to 14.9%.
- Hospitals revenue rose 14% YoY to ₹3,183 Cr with EBITDA margins at 24.8%.
- Apollo HealthCo revenue grew 24% YoY to ₹2,972 Cr, led by strong pharmacy traction.
- AHLL revenues grew 20% YoY to ₹467 Cr, with margins improving to 10.2%.
Business highlights
- ARPP stood at ₹1.81 lakh (+4% YoY) supported by richer case mix (cardiac, oncology, transplants).
- Inpatient volumes grew 4%; overall growth driven by 5% volume, 4% case mix, 5% pricing.
- 4,444 beds planned over 4 years with a capex of ₹8,200+ Cr; ₹2,800 Cr already incurred.
- 1,500 beds to be added over the next year; 40–50% expected operational in FY27.
- Apollo HealthCo added 185 net stores in Q3 (7,113 total); targeting 600 additions annually.
Outlook
- Existing hospitals expected to grow 13–14%, with new beds adding 3–4% incremental growth.
- EBITDA drag of ₹140–150 Cr from new hospitals in FY26; profitability to improve as occupancy ramps.
- HealthCo EBITDA positive post 24/7 and ESOP costs; integration with Keimed to drive scale benefits.
- FY26E revenue projected at ₹25,047 Cr with EBITDA margins at 14.9%, expanding to 15.9% by FY28E.
- Improving RoCE (17% to 21% by FY28E) and deleveraging support sustained earnings compounding.
Recent Updates on Apollo Hospitals Ltd.
- Expansion of hospital capacity in key metro clusters.
- Continued investment in Apollo 24/7 platform integration.
- Strategic restructuring to streamline business verticals.
- Expansion of specialty centers in oncology and cardiology.
- Ongoing focus on debt reduction and capital discipline.
Company valuation insights – Apollo Hospitals Ltd.
Apollo Hospitals is currently trading at a TTM P/E of 60.27x, compared to the industry average of 58.35x, after delivering a strong 25.2% return over the last one year, significantly outperforming the NIFTY 50’s 11.6% gain. The premium valuation reflects sustained double-digit revenue growth, continued margin expansion across segments, improving return ratios, and strong visibility from its aggressive capacity addition plans and HealthCo value-unlocking initiatives.
The investment case for Apollo is anchored in structural healthcare demand, improving case mix, and a scalable omni-channel healthcare ecosystem. Q3FY26 revenue grew 17% YoY with EBITDA margins expanding to 14.9%, driven by hospital margin strength (24.8%) and improving profitability at AHLL and HealthCo. ARPP improved 4% YoY supported by richer specialties (cardiac, oncology, transplants), while inpatient volumes grew 4%. The company has embarked on a significant expansion plan to add 4,444 beds over four years with ₹8,200+ crore capex, strengthening medium-term growth visibility. Apollo HealthCo has turned EBITDA positive post 24/7 and ESOP costs, with proposed integration of Keimed and potential listing acting as key value-unlocking triggers. Improving RoCE trajectory (towards 21% by FY28E) further strengthens the compounding story.
From a valuation standpoint, using a Sum-of-the-Parts (SoTP) approach, we arrive at a 12-month target price of ₹9,600, implying an upside potential of 24% from current levels. Over the near term, we assign a 3-month target price of ₹8,200, indicating a 6% upside, supported by sustained hospital growth, gradual ramp-up of new beds, improving HealthCo profitability, and continued margin expansion across segments.
Major risk factors affecting Apollo Hospitals Ltd.
- Execution Risk: Timely ramp-up of new hospital capacities and specialty centers.
- Regulatory Risks: Healthcare pricing regulations and insurance reimbursement changes.
- Competition: Intensifying competition in metro hospital clusters.
- Digital Monetization Risk: Apollo 24/7 profitability timeline and customer acquisition costs.
- High Capex Nature: Healthcare expansion requires sustained capital investments.
Technical analysis of Apollo Hospitals Ltd. share
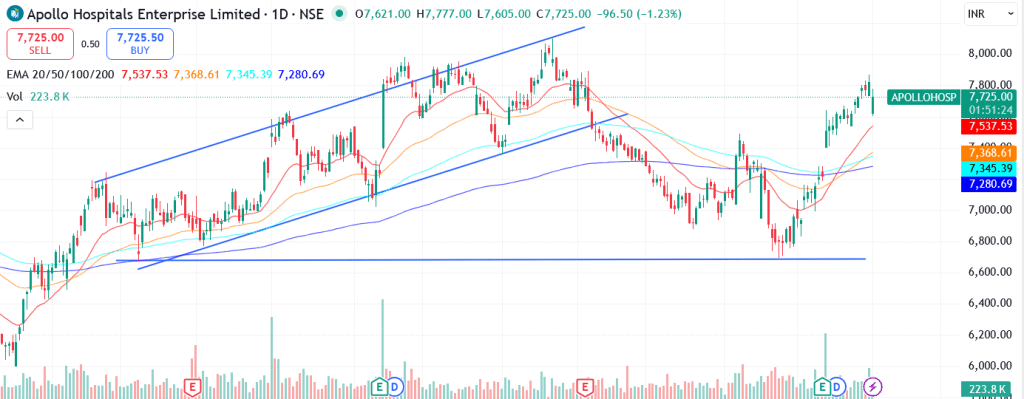
Apollo Hospitals is currently in a strong structural uptrend, with the price trading comfortably above its 20-, 50-, 100-, and 200-day EMAs. This alignment across short-, medium-, and long-term moving averages indicates sustained buying pressure and a well-established bullish trend, with EMAs likely to act as dynamic support during minor corrections.
Momentum indicators reinforce the strength of the trend. The MACD at 172.28 is firmly in positive territory and trading above the signal line, confirming ongoing bullish momentum. The absence of bearish divergence suggests continuation bias remains intact.
The RSI at 76.58 reflects heavy buying interest and indicates that the stock is in strong momentum mode. While technically in overbought territory, strong stocks in established uptrends can remain overbought for extended periods. The Relative RSI (21-day at 0.13 and 55-day at 0.14) highlights consistent outperformance versus the broader market, signaling institutional participation and sector leadership.
The ADX at 32.31 confirms a strong and established trend, suggesting that momentum is not merely short-term but structurally supported.
A sustained move above ₹8,200 (resistance zone) could open the pathway toward ₹9,600, aligning with the 12-month fundamental target. On the downside, ₹7,200 remains a crucial support level; holding above this zone preserves the broader bullish structure and keeps the uptrend intact.
- RSI: 76.58 (Bullish; heavy buying interest)
- ADX: 32.31 (Strong trend)
- MACD: 172.28 (Positive; above the signal line)
- Resistance: ₹8,200
- Support: ₹7,200
Apollo Hospitals Ltd. stock recommendation
Current Stance: Buy, with a 3-month target of ₹8,200 (6% upside) and a 12-month target of ₹9,600 (24% upside), based on a Sum-of-the-Parts (SoTP) valuation approach.

Why buy now?

Consistent double-digit revenue growth driven by strong hospital volumes, improving case mix, and steady ARPP expansion.

Sustained margin expansion with hospital EBITDA margins 25% and blended margins trending upward as HealthCo and AHLL profitability improves.

Large, phased capacity expansion of 4,444 beds over four years, strengthening medium-term growth visibility.

Apollo HealthCo turning EBITDA positive, with integration of Keimed and potential listing acting as key value-unlocking triggers.

Improving return ratios (RoCE trending toward 21%) alongside controlled leverage, supporting long-term earnings compounding.

Portfolio fit

Apollo Hospitals provides exposure to India’s structural healthcare growth story through a market-leading integrated platform spanning hospitals, pharmacy, diagnostics, and digital health. With strong brand equity, scalable operations, improving capital efficiency, and visible expansion-led growth, the stock fits well in portfolios seeking structural compounding, defensive growth characteristics, and long-term value creation beyond cyclical sectors.
If you found this helpful and want regular stock trade calls, check out my community on StockGro here: https://app.stockgro.club/ui/social/tradeViews/groupFeed/07a7b961-b8ca-42ce-baf3-a9eec781b6ebApollo Hospitals Ltd.: Budget 2026-27 opportunities
- Healthcare Infrastructure Push: Government incentives for hospital expansion in tier-2/3 cities.
- Insurance Penetration Schemes: Expanded coverage under public health insurance programs.
- Medical Tourism Promotion: Policy support for India as a global healthcare hub.
- Digital Health Incentives: Support for telemedicine and integrated digital health ecosystems.
- Tax Benefits for Healthcare Investments: Accelerated depreciation or funding incentives.
Final thoughts
Apollo Hospitals Enterprise Limited stands at an inflection point, evolving from a hospital-led operator to a fully integrated healthcare platform. With rising healthcare demand, improving payor mix, operating leverage from mature assets, and disciplined capital allocation, the company is positioning itself for sustainable margin expansion.
For investors seeking exposure to India’s structural healthcare growth with scalability from digital integration and pharmacy expansion, Apollo offers a blend of defensive demand visibility and long-term compounding potential.