Stock overview
| Ticker | LT |
| Sector | Engineering & Construction, Heavy Infrastructure |
| Market Cap | ₹ 4,85,000 Cr (Large cap) |
| CMP (Current Market Price) | ₹ 3,564 |
| 52-Week High/Low | ₹ 3,675/ ₹ 2,874 |
| P/E Ratio | 25.3 (vs Industry Avg. of 22.1) |
| Dividend Yield | 1.2% |
| Beta | 1.10 (Moderately volatile compared to NIFTY 50) |
About Larsen & Toubro Ltd.
Larsen & Toubro (L&T) is India’s engineering powerhouse, driving innovation in infrastructure, technology, and defence since 1938. From iconic skyscrapers to cutting-edge metro systems, L&T builds the future with excellence and reliability. With a global footprint and a legacy of innovation, it’s more than a company—it’s the force behind India’s progress!
Key drivers of growth:
1. Robust order book:
- L&T’s order book stood at a record ₹4.2 lakh crore as of Q3 FY25, reflecting strong demand across core engineering, procurement, and construction (EPC) segments.
- Domestic orders contribute 72%, showcasing resilience in India’s infrastructure growth story.
2. Diversified business model:
- Business spans across infrastructure, heavy engineering, IT services (Mindtree, LTIMindtree), and financial services.
- L&T’s IT arm, LTIMindtree, is emerging as a significant value driver with consistent double-digit growth.
3. Government push:
- The Union Budget 2025 is expected to provide a significant boost to sectors like renewable energy, urban infrastructure, and railways, all of which align with L&T’s expertise.
Recent Financial Performance (Q3 FY25)
| Metric | Q3 FY 25 | Q3 FY 24 | YoY Growth |
| Revenue | ₹ 64,668 cr | ₹55,271 cr | +17% |
| Net Profit | ₹ 3,358 cr | ₹ 2,954 cr | +14% |
| EBITDA Margin | 9.7% | 10.5% | -0.8% pts |
| Order inflows | ₹ 1.16 lakh cr | ₹ 0.75 lakh cr | +53% |
Highlights:
- Revenue growth was modest due to a slowdown in the execution of some international projects.
- Net profit increased YoY but margins contracted.
- Order inflows remained very healthy, driven by strong domestic demand in the infrastructure sector.
Valuation insights
When we value a company like Larsen & Toubro (L&T), we’re asking two questions:
- Is it cheap or expensive compared to how it’s been in the past—or to other companies?
- How much money could it make in the future, and what does that mean for its stock price now?
From a relative valuation standpoint:
- L&T currently trades at a P/E ratio of 25.3. This means investors are willing to pay ₹25.3 for every ₹1 of the company’s earnings. This ratio is slightly above its historical average of 24.1, indicating that the market has a positive outlook on L&T’s future earnings potential.
- EV/EBITDA: The ratio is at 15.1x. This metric helps investors understand how much they are paying for the company’s operating earnings before accounting for debt and other factors. A higher ratio suggests that L&T is viewed as a market leader with strong cash flows, which is crucial for funding future projects and expansions.
As per Discounted Cash Flow analysis:
It estimates the intrinsic value of L&T based on expected future cash flows:
- Intrinsic Value Estimate: ₹3,800
- Upside Potential: There is a potential upside of 10%, meaning the stock could increase in value from its current price.
- Assumptions:
- Revenue CAGR: 12% (FY25-FY30)
- EBITDA Margin: Stable at ~15%
- WACC: 10.5%
- This is a blended cost that factors in both borrowings (at 8% post-tax) and the return investors expect on their equity (12%).
Key risks to watch
- Execution risks: Delays in large-scale projects could impact profitability.
- Rising Input costs: Inflationary pressures on raw materials like steel and cement.
- Global exposure: 28% of the order book is international, subjecting L&T to geopolitical risks.
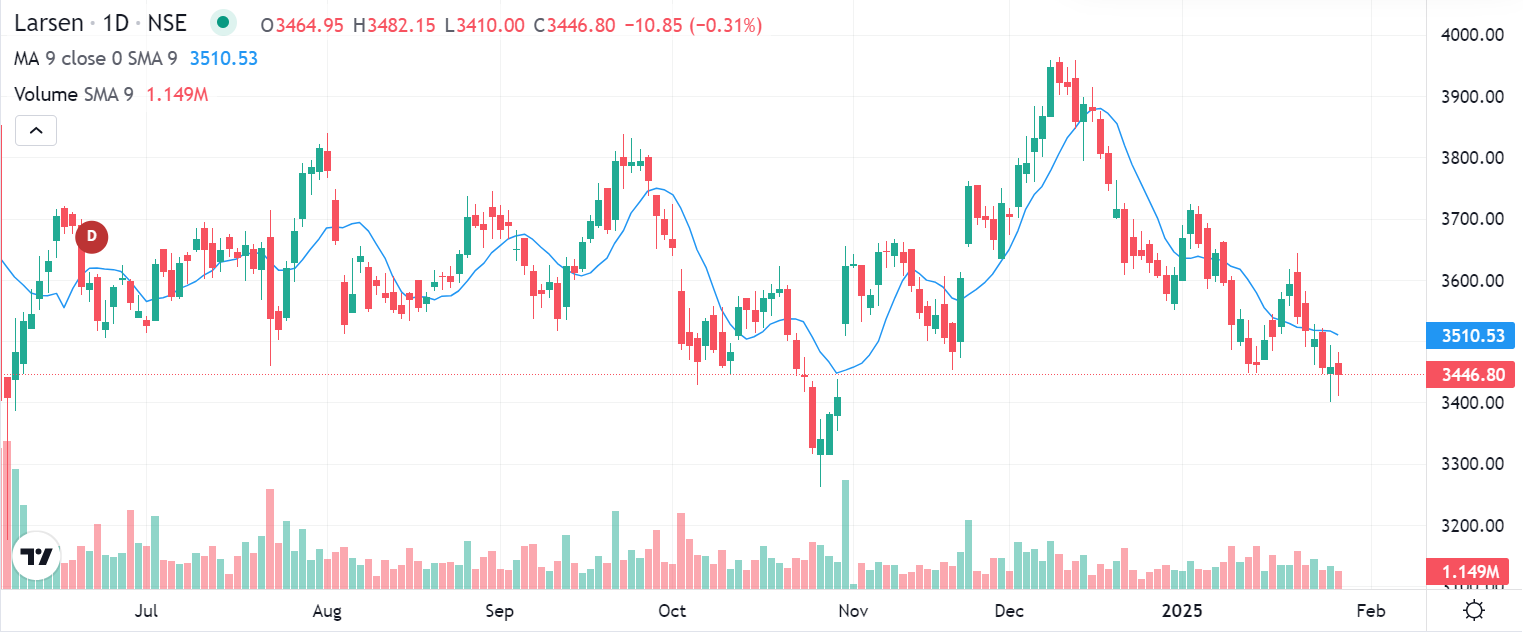
Technical outlook on L&T share
- Short-Term View: The stock has shown strong momentum, trading above its 50-day moving average of ₹3,400.
- RSI: 65 (Approaching overbought zone).
- Support Levels: ₹3,400
- Resistance Levels: ₹3,500
- Trading Volume: A consistent rise in trading volume over the past month indicates sustained buying interest, adding to the bullish outlook.
Competitor analysis for L&T
Key financial metrics (FY 24 snapshot)
| Company | Market Cap (₹ cr) | P/E Ratio | EBITDA Margin | RoE |
| L&T | 4,85,000 | 25.3 | 9.7% | 16.2% |
| BHEL | 72,000 | 34.5 | 8.5% | 6.5% |
| ABB India | 1,10,000 | 55.2 | 12.4% | 13.8% |
| Siemens India | 1,25,000 | 67.4 | 13.2% | 15.5% |
Observations:
- L&T remains the leader in the infrastructure and engineering sector with a market cap significantly larger than its peers.
- Despite a higher P/E ratio, its consistent execution and healthy order book justify the premium valuation.
- Margins are stable compared to competitors, showcasing operational efficiency and disciplined cost management.
- Strong RoE reflects superior returns for shareholders versus peers like BHEL and ABB.
Union Budget 2025: Key expectations
- Infrastructure push: A likely increase in allocations to the PM Gati Shakti initiative, highways, and smart cities will directly benefit L&T.
- Renewable energy transition: Policies supporting green hydrogen, solar infrastructure, and energy storage systems present new avenues for growth.
- Defence sector allocation: With its foray into defence manufacturing, L&T could benefit from higher defence capex.
- Railways & Metro Projects: Increased railway capex and metro expansion across cities are expected to drive incremental orders.
L&T stock recommendation
Current Stance: Buy with a target price of ₹3,800 (12-month horizon).

Rationale:

-Strong order book with consistent execution.

-Budgetary support for infrastructure provides a clear growth runway.

-Diversified business model reduces cyclicality.

Portfolio Fit: Ideal for growth-oriented investors seeking exposure to India’s infrastructure boom.
If you found this helpful and want regular stock trade calls, check out my StockGro profile here: https://stockgro.onelink.me/vNON/6m6ykj0d