Financial statements are the backbone of any big business. They help track money, assets, and liabilities for any corporation in a way that’s easy to read, understand, and standardise across the world. These written records also act as a surefire way of understanding a company’s financial health and performance.
In this article, we’re going to cover the three major financial statements, explore what they cover and their significance, and how they link together.
The three main financial statements
Understanding financial statements is crucial for investors, stakeholders, and anyone keen on comprehending the financial status, trajectory, and value of a business. Let’s start with the income statement.
You may also like: The Capital Asset Pricing Model (CAPM) – Explained
Income statement (or the profit and loss statement)
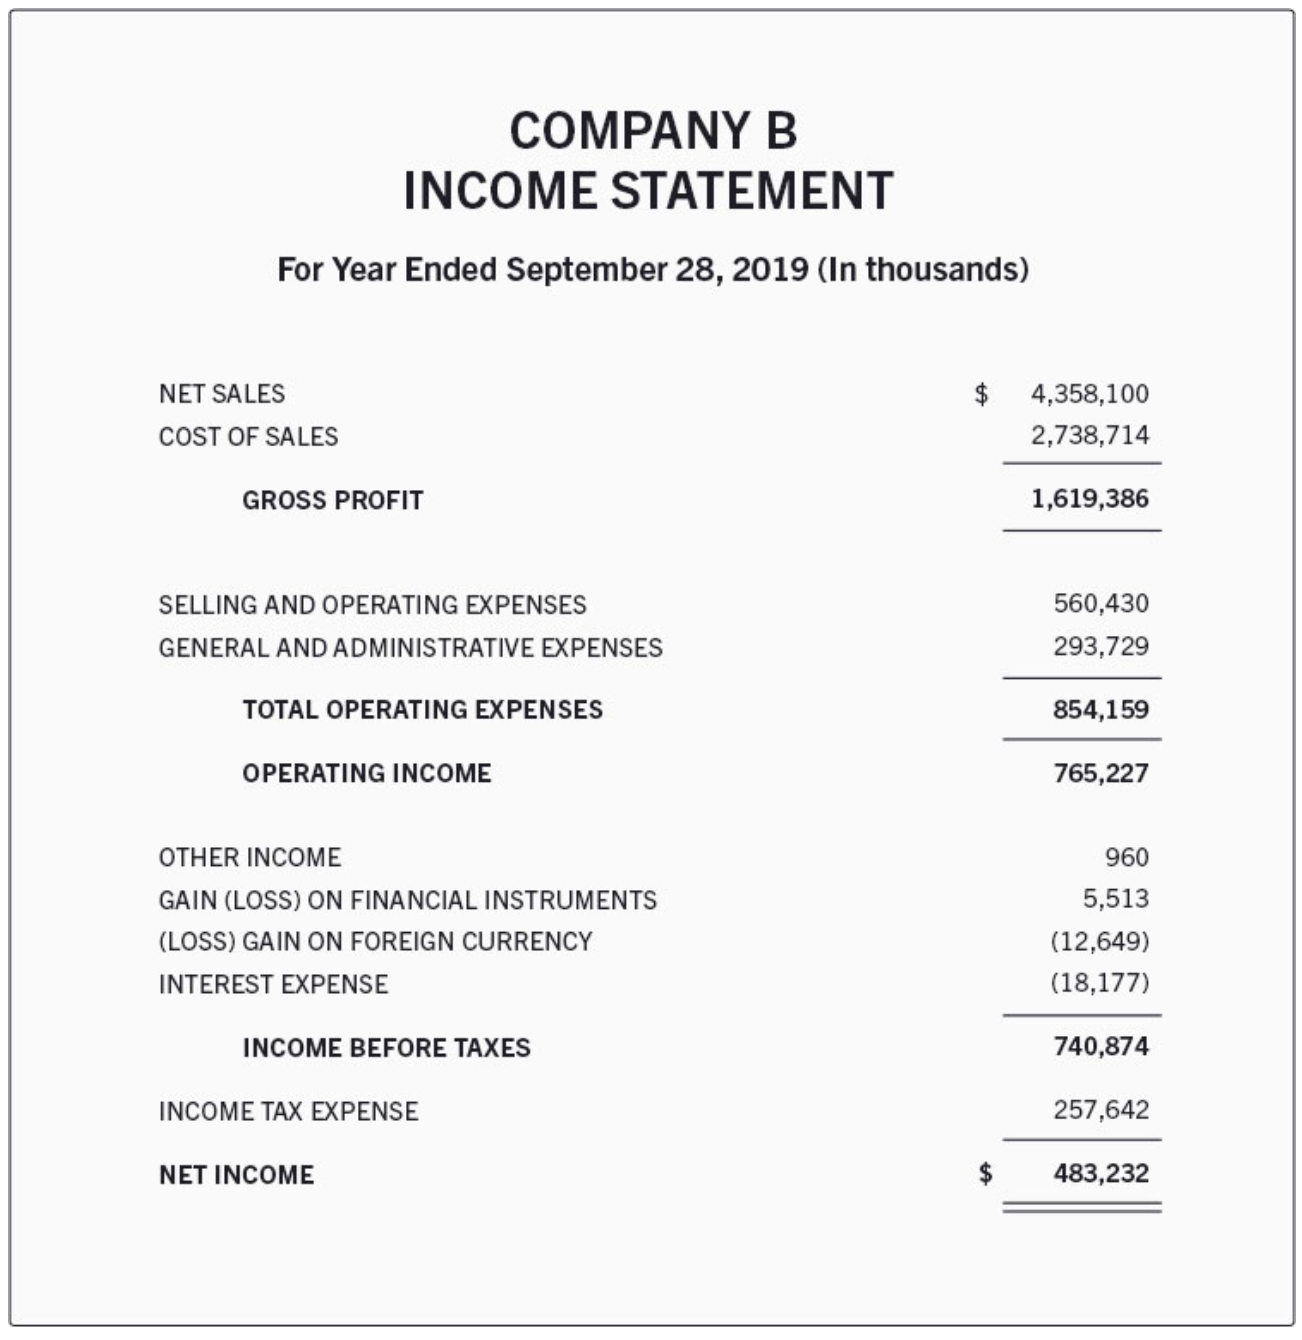
The income statement summarises a company’s revenues, expenses, and profits over a specified number of months (quarter, 9 months, or the fiscal year). The income statement’s main contents are the revenue earned and the cost of goods sold (COGS), which are used to determine the gross profit.
Revenues for a company is the dollar amount earned by selling goods or services. This doesn’t account for any expenses.
Then, operating expenses (like salaries, rent, and utilities) are subtracted, arriving at operating income, which is also known as the EBIT. Finally, after accounting for non-operating income and expenses, taxes, and interest, the net income is calculated. This net income (or net profit) is the entry that the balance sheet starts with.
The primary expenses that the income statement covers are: the COGS, selling, general and administrative expenses (SG&A), and R&D. Interests paid on loans, debt, or losses from the sale of an asset are also recorded as expenses in this statement.
Gross profit = Revenues – COGS
Operating profit (or EBIT) = Gross profit – SG&A
Net income = Operating Income (or EBIT) – Taxes
Also Read: Beat the market: Your ultimate guide for fundamental analysis tools.
Balance Sheet
The balance sheet provides a snapshot of a company’s financial position at a specific point in time. It comprises three main sections: assets, liabilities, and shareholders’ equity.
Assets include:
- Cash and cash equivalents – These include treasury bonds and deposit certificates
- Accounts receivables – This is the money that other entities owe to the company for purchase of their goods and services
- Inventory on hand – The inventory of goods that the business holds for sale
- Prepaid expenses – These could be a yearly payment of their insurance premiums, etc. They’re recorded as assets because these are investments whose benefits have not yet been recognised
- Property, Plant, and Expenses (PP&E) – Capital assets owned by the company for its long-term benefit
Liabilities include:
- Accounts payable – Bills due as part of the normal course of operations of a business
- Wages and notes payable – Wages are salaries paid to employees, and notes payable are official debt agreements that come with a set payment schedule.
- Dividends – A part of earnings awarded to shareholders
The equity of the company, intuitively, is the total value of the assets of the company minus the total value of its liabilities. Shareholders’ equity represents the company’s net worth.
Assets = Liabilities + Shareholders’ Equity
or
Shareholder’s Equity = Assets – Liabilities
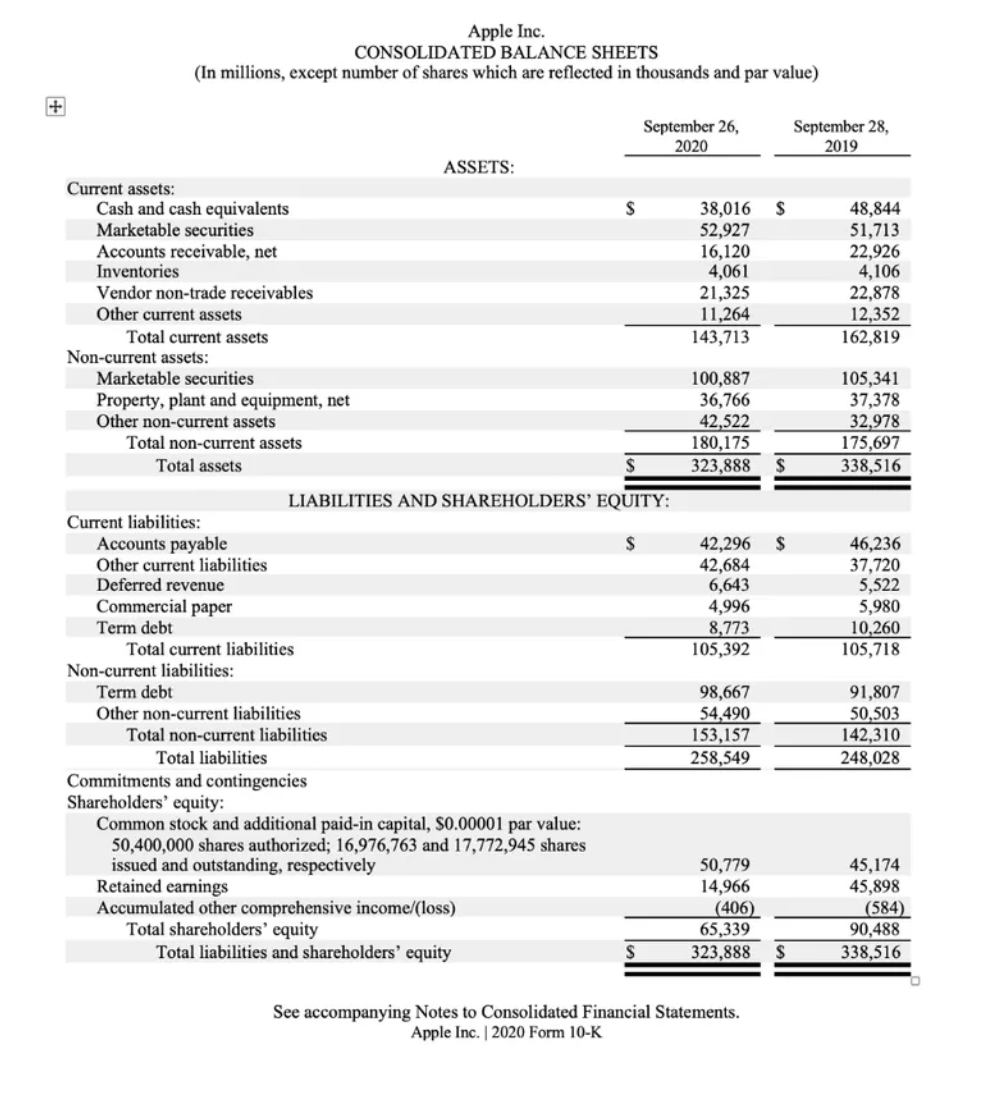
This is a snapshot of a typical balance sheet, with two distinct parts: Assets, and Liabilities and Shareholders’ Equity. As a rule, total assets have to be equal to a sum of liabilities and shareholders’ equity.
Also Read: Decoding the cash reserve ratio: Your guide to understanding banking reserves
Cash flow Statement
The cash flow statement tracks the inflow and outflow of cash in a company. It’s divided into three sections: operating activities, investing activities, and financing activities.
Operating activities: Operating activities involve cash generated from core business operations. These include accounts receivable, depreciation, inventory, and accounts payable (all referenced from the balance sheet). These transactions also include operating expenses like wages, rent, cash receipts, etc.
Investing activities: Investing activities cover cash used for investments, acquisitions, or asset purchases/sales. Loans made to vendors or received from customers, PPE, and other fixed assets are also included in this section.
Financing activities: Financing activities detail cash related to debt, equity, dividends, and loans. Investors assess a company’s ability to generate cash and its sources and uses of cash. Financing activities include debt issuance, equity issuance, stock repurchases, loans, dividends paid, and repayments of debt.
Interpreting the numbers in financial statements
Analysing financial statements might seem pretty straightforward, but it hardly ever is. Here are some things that you must keep in mind when attempting to understand a business through its financial statements:
- Compare them over time – It is only by analysing financial statements over multiple periods can you get insights into a company’s performance trends. Most investors look for things like consistent growth or decline in revenues, profits, and key ratios.
- Read the footnotes and disclosures – The financial statements aren’t enough by themselves in understanding a company. These statements often also include footnotes and disclosures that can reveal significant details about accounting policies, risks, and contingencies.
- Peer comparison – In modern financial markets, no company is analysed in isolation – its ratios and comps are always compared to similar companies in the same industry. This analysis helps in understanding the company’s standing within its sector and identifying areas where it outperforms or lags.
Conclusion
Financial statements are the bedrock of financial analysis. They offer a window into a company’s operations and financial health, enabling you to make more informed decisions. By understanding how to read and interpret these statements, you can gain valuable insights into a company’s performance and prospects, ultimately aiding in making sound investment or business-related choices.