
Our country’s BSE (Bombay Stock Exchange) currently lists 5289 companies. The big question is, how do you determine which stocks are worth your investment?
There are two primary tools to decide: technical analysis and fundamental analysis.
Technical analysis is the process of examining historical market data, typically price and volume, to forecast where the stock might go next.
Meanwhile, fundamental analysis in investment management involves evaluating a company’s intrinsic value. You examine A-Z of the company, from its earnings and expenses to its management team and competitive position in the industry. If the company looks healthy, it might be a good investment.
You may also like: How does arbitrage trading work?
Fundamental analysis meaning
Fundamental analysis’s main purpose is to ascertain the intrinsic value of a stock. It involves figuring out if the market has overvalued or undervalued a stock. Hence, if the intrinsic value is higher than the market price, it hints to buy. If it’s lower, selling or avoiding the stock altogether might be better.
Either a top-down or bottom-up strategy is used in the analysis. In a top-down approach, it begins by evaluating macroeconomic indicators, such as global and national economic conditions. The analysis then narrows its focus to specific industries before delving into individual companies.
The types of fundamental analysis based on data – qualitative and quantitative.
Quantitative data consists of numerical figures typically extracted from financial statements, like earnings, revenue, and liabilities. Qualitative data comprises non-numerical factors, such as the effectiveness of a company’s management, competitive positioning, and market share.
For investors, fundamental analysis is crucial because it provides a comprehensive view of a company’s overall health and future prospects. A thorough analysis can reveal if the current stock price reflects the company’s actual worth and, hence, if it presents a good investment opportunity.
Understanding quantitative analysis
When talking about components of fundamental analysis, the role of quantitative analysis is often likened to a financial health check-up for companies. This method is all about using hard numbers to measure a business’s performance.
When people say a company “has good numbers,” they’re essentially talking about favourable results from quantitative analysis. To get these numbers, there are fundamental analysis tools that help you analyse the data, offering clear insights to guide your investment decisions.
Fundamental analysis tools
The data you need for quantitative analysis are usually easy to find online. So, it’s no surprise that many experts and everyday investors use this approach.
Now, let’s delve deeper and take a look at the commonly used fundamental analysis tools with quantitative data:
- Financial statements
- Earnings
- Financial ratios
Financial statements
There are three financial reports.
- Balance sheet: This report offers a brief overview of a business’s financial state at a certain period, capturing assets, liabilities, and shareholders’ equity. The key equation is Assets = Liabilities + Shareholders’ Equity. A strong balance sheet typically shows assets exceeding liabilities, signalling good financial health.
- Income statement: This statement offers insights into a company’s profitability over a certain period, usually a quarter or a year. It details revenue, expenses, and, ultimately, net income. Consistent growth in net income is a positive sign, while erratic or declining profits warrant further analysis.
- Cash flow statement: This focuses on cash transactions over a period, categorised into operating, investing, and financing activities. It is a solid indicator of a company’s liquidity as it only considers actual cash inflows and outflows.
Reading these statements will give you a thorough knowledge of a company’s financial situation. Each statement reveals different aspects, and the interplay among them offers the most valuable insights.
Earnings
In the context of stock analysis, earnings remain a focal point for investors. Earnings are the net income a company secures after accounting for all operational costs.
- Quarterly earnings: Publicly traded companies release quarterly earnings reports, offering insights into short-term performance. Analysing these reports can provide a snapshot of current business conditions and operational effectiveness.
- Projected earnings: These are future earnings estimates derived by extrapolating current financial data. While these projections are subject to market risks, they offer valuable foresight into a company’s growth trajectory.
The cardinal rule in investment is to seek companies with robust and consistent earnings. A strong earnings profile often translates to reduced borrowing needs and enhanced investor interest, leading to stock price appreciation. Therefore, an analysis of earnings can be instrumental in making informed investment decisions.
Financial ratios
When figuring out how to do a fundamental analysis of stocks, one can’t overlook the significance of financial ratios. A financial ratio is a numerical comparison of two figures from a company’s financial statements. Here are four widely used financial ratios.
- Earnings per share (EPS): It represents a portion of a company’s profit allocated per outstanding share of common stock. It’s calculated using the formula:
EPS=Net income/ Total outstanding shares
For instance, if Company A registers a net income of Rs. 5 crores with 10 lakh outstanding shares, its EPS would be Rs. 50.
An investor can compare this to other companies within the same industry to make informed decisions. Remember, a higher EPS usually signals more profit, but the context is key.
To know more: Earnings Per Share (EPS): What it means and how to calculate it.
- Price-to-earnings (P/E) ratio: It tells the amount investors are ready to pay for a company’s earnings.
P/E = Stock price/ EPS
Suppose a company’s share price is Rs. 500, and its EPS is Rs. 50. The P/E ratio is 10. A lower P/E ratio usually indicates a stock is undervalued, making it an attractive investment and vice versa.
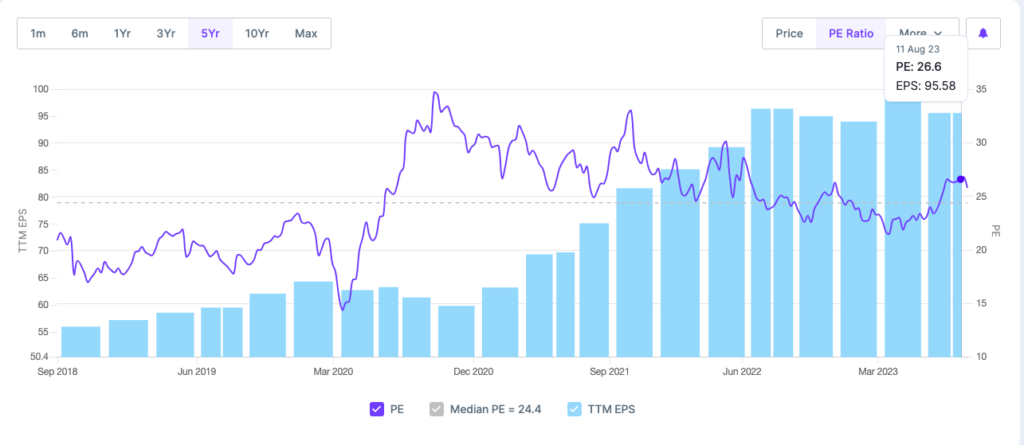
P/E ratio of Reliance Industries Ltd. for the last 5 years
Dive deeper: Understanding the P/E ratio
- Return on equity (ROE): It shows how successfully a business is generating profit from shareholders’ equity.
ROE = Net income/ Shareholders′ equity
If company C generates Rs. 2 crores in profits with shareholders’ equity standing at Rs. 20 crores, the ROE would be 10%. Comparing a company’s ROE to others in the same industry is essential for an accurate evaluation.
- Price-to-book (P/B) ratio: This ratio assesses a stock’s valuation by contrasting its market value to book value.
P/B = Market price per share/ Book value per share
For example, if the last closing price of a stock is Rs. 100 and its book value per share is Rs. 80, the P/B ratio is 1.25. A P/B ratio below 1 generally signifies that the stock is undervalued.
Bottomline
A grasp of fundamental analysis tools is key for keeping a close watch on a stock’s health and making smart investment choices. Even if you’re not diving deep into a full analysis, knowing these tools helps you decide when it’s a good time to buy, keep, or sell a stock, considering its actual worth compared to its market price.