In India, the demand for electricity is increasing constantly as a result of rising economic activity (especially manufacturing) and increasing temperatures. Air conditioner sales are a clear reflection of this trend, with AC sales expected to reach around 18 million units in FY26.
As of FY25, India has an electricity generation capability of 475 GW (Gigawatts), of which 46.68% are coal-powered thermal power plants. In the same time period, India generated 1821 billion units of electricity, which is roughly 43.8% of the installed capacity.
There are multiple government and private companies that are involved in electricity generation and supply in India. In this blog, we will take a look at Adani Power and NTPC comparison, which are two of India’s biggest electricity generation companies.
Also read: Mahindra vs Ashok Leyland: Who’s leading the commercial vehicle market?
Company Overview
Here is a brief overview of Adani Power and NTPC:
Adani Power Limited
Adani Power Limited is involved in the business of generating electricity, it is the biggest private thermal power company in India. Adani Power sells electricity through long and short-term Power Purchase Agreements (PPA).
As of FY25, Adani Power owns the following:
- 12 power plants with an operating capacity of 17.55 GW
- 9 power plants under construction to provide an additional 13.12 GW power generation capability.
Adani Power has tie-ups to sell 87% of its electricity through PPAs, which means a fixed customer base for the company. In FY25, the company sold 96 billion units of electricity.
In FY25, the company owes ₹37,817 crores as secured external debt, and for the same period, the company earned a net profit of ₹12,750 crores.
NTPC Limited
National Thermal Power Corporation (NTPC) Limited is involved in the business of generating electricity. NTPC is the biggest electricity-generating company in India. NTPC generated 439 billion units of electricity in FY25.
As of FY25, the company has an installed capacity of 80 GW and an upcoming capacity of 34 GW. The proportion of different modes of electricity for the total 80GW operational capacity is as follows:
- 79% – Coal
- 8% – Solar
- 8% – Gas
- 5% – Hydro
- 1% – Wind
To power the thermal plants, NTPC also mines coal. It owns 9 coal blocks and mined 46 million metric tons of coal in FY25. The company also aims to develop 30 GW of nuclear power capacity.
Also Read: NTPC stock analysis & expert Insights in detail
NTPC Vs Adani Power Comparison
Let us take a look at the financials and ratios of Adani Power Limited and NTPC Limited:
| Particulars (₹ crores) | Adani Power | NTPC |
| Market Capitalisation (as on 28th May 2025) | 2,16,104 | 3,29,153 |
| Sales | 56,203 | 1,88,138 |
| Operating Profit | 21,305 | 54,128 |
| Operating Profit Margin | 37.9% | 28.77% |
| Net Profit | 12,750 | 23,953 |
| Net Profit Margin % | 22.68% | 15.92% |
| Earnings per share | 33.55 | 24.16 |
| Particulars (on 28th May 2025) | Adani Power | NTPC |
| ROE% | 25.6% | 13.6% |
| ROCE% | 22.5% | 10.8% |
| Price to Earnings Ratio | 17 | 14 |
| Price to Book Value | 3.83 | 1.78 |
| Debt to Equity | 0.70 | 1.36 |
| Interest Coverage Ratio | 5.90 | 3.45 |
| Electricity generated (billion units) | 96 | 439 |
| Plant Load Factor (PLF) | 71% | 90% |
| Average Tariff | 4.16 / KWh | 4.70 / KWh |
- Sales: NTPC Limited had higher sales than Adani Power Limited in FY25 because NPTC sold 439 billion units of electricity, whereas Adani Power sold 96 billion units of electricity. A bigger scale of operations led to more sales for NTPC.
- Profitability: NTPC has higher operating profit and net profit than Adani Power. However, Adani Power has a higher operating profit and net profit margin than NTPC, meaning that Adani Power converts its revenues into net profits with better efficiency.
- Market capitalisation: NTPC has a higher market capitalisation than Adani Power. In terms of valuation ratios like Price-to-earnings ratio and Price book value, Adani Power is above NTPC, meaning investors might have more confidence in the future prospects of Adani Power.
- Debt: The debt-to-equity ratio and the interest coverage ratio clearly show that Adani Power can more easily fulfil its interest and debt liabilities, as compared to NTPC. NTPC has a debt-to-equity ratio of 1.36, showing a significant debt burden.
- Return ratios: Adani Power has a higher return on equity and return on capital employed than NTPC. This indicates Adani Power is generating higher returns for both equity shareholders and overall capital employed, likely due to superior operational efficiency or better asset utilisation.
- Plant load factor: The plant load factor shows the actual electricity generated as compared to the total installed capacity. PLF for Adani Power is lower than NTPC, showing that NTPC uses its installed capacity to a greater extent than Adani Power.
- Average Tariff: Adani Power charges its customers an average tariff of ₹4.16 / KWh, as compared to ₹4.70/KWh charged by NPTC. This is the price charged for 1 unit of electricity by the company.
NTPC Vs Adani Power stock price
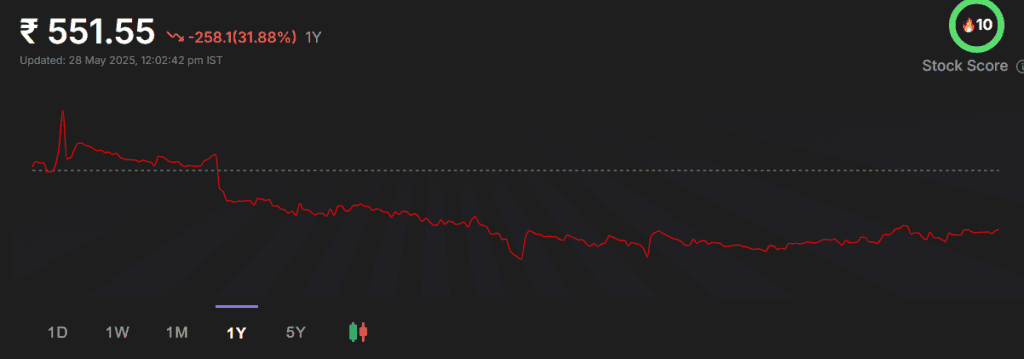
Adani Power shares are trading at ₹551 as of May 28, 2025. The stock has made a 52-week high of ₹1,090.16 and a 52-week low of ₹425.60.
The stock has returned -31.88% in the last year, and it returned 385% in the last 5 years.
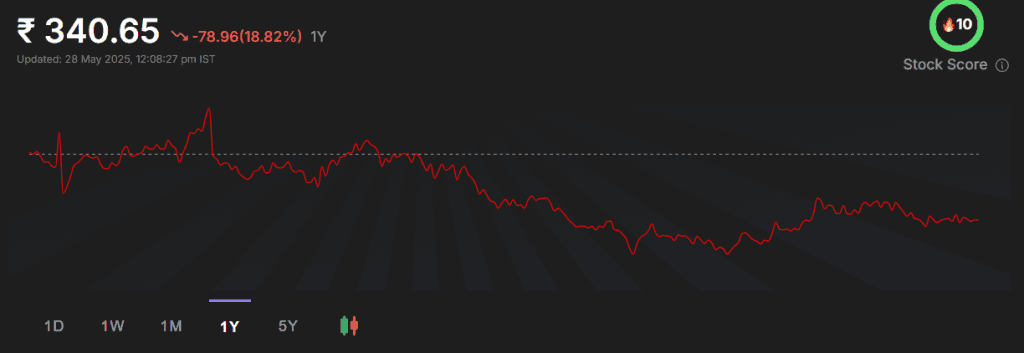
The shares of NTPC Limited are trading at ₹340 as of May 28, 2025. The stock made a 52-week high of ₹486.86 and a 52-week low of ₹290.04.
In the past year, the stock has returned -18.82% and in the last five years, the stock has returned 157%.
An interesting read: Adani Green vs Tata Power: Who leads the charge in India’s evolving power sector?
Conclusion
While comparing NTPC Vs Adani Power, we can see that NTPC has a much higher scale of operations. On the other hand, Adani Power reflects higher operational efficiency and manageable debt as compared to NTPC. Investors should carefully read the annual and quarterly reports of both companies before making an investment decision.