The equity market is prone to high degrees of influence by the bulls and bears.
When the bulls dominate, the prices increase, creating an uptrend market.
When the bears dominate, the prices decrease, forming a downtrend market. Explore the dynamics of the bull vs bear market and learn effective strategies to thrive in both bullish surges and bearish downturns.
But, in a scenario where neither of them are able to dominate, the market becomes indecisive.
The spinning top candlestick pattern is an indication such market indecisions.
What is Spinning Top Candle
A spinning top candlestick gets formed in a market of indecision. Where both bulls and bears are unable to take control of the market, the stock prices move sideways. The absence of dominance makes this market non-trending. Explore the fascinating world of candlestick chart patterns. Discover the significance, types, and trading techniques of these visual stock market indicators, and embark on a journey to master the art of stock trading.
A candle with a short body and equally long wicks on both ends is called a spinning top candle.

How is the spinning top candlestick formed?
The spinning top candlestick is sometimes forms at the top of the chart and sometimes at the bottom. The one formed at the bottom is also called the spinning bottom candle.
Imagine the game of tug of war between two equally powerful teams. When the rope is about to reach one end, the opposite team pulls it in the other direction. This happens until both teams give up, and the rope finally drops in the centre, where the game began.
The market scenario is similar to this during the spinning top formation.
When there is equal pressure from the bulls and bears to take the prices up and down respectively, but none succeed, the stock closes near the opening price.
This forms a small body and long wicks on the upper and lower ends of the candle.
You may also like: Discovering the secrets of the inverse head and shoulders pattern
Interpreting the spinning top pattern
You may have a fair idea of the spinning top candlestick now.
Let us consider an example to understand the interpretation of this candlestick better.
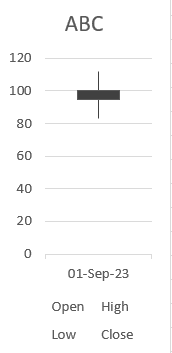
Stock ABC opens at ₹ 100 today.
A set of bullish traders who speculate a rise in its price aggressively start buying before the prices increase further.
It increases the demand for the stock, and the price goes up to ₹ 112.
Another set of traders who are pessimistic about ABC’s prices go bearish and start selling their stocks with the same level of aggression.
The supply increases, bringing the prices down to ₹ 83.
Both bulls and bears continue to put pressure, but fail to sustain. The price finally closes at ₹ 95, near the opening price of ₹ 100.
A spinning top candle forms here because:
- The opening and closing prices are near, which forms a small body. (Difference of ₹ 5)
- The high and low prices are far from the opening and closing prices, forming long wicks on both ends. (Difference of ₹ 12 on both sides)

This represents a market of uncertainty where nobody is able to impact the price movements in one specific direction.
The spinning top appearing after a specific trend may indicate a reversal. However, this is not true in every case.
Hence, the spinning top candle, is an indicator of indecision rather than reversals.
Also Read: Hammer Candlestick Patterns – Explanation and Interpretation
Bullish spinning top candlestick pattern
When the closing prices are greater than the opening prices, it forms a bullish spinning top candlestick.
These candles are usually green in colour.
Candles with higher closing prices are bullish because the bulls are able to push the price slightly above the opening price. Even though they do not create a trend, bulls succeed in moving the price upward to some extent.
The bullish candles are sometimes found at the bottom of a downtrend, which may indicate a bullish reversal.
Also Read: Trading the triple top pattern: A guide
Bearish spinning top candle
When the closing prices are lower than the opening prices in the spinning top candlestick, it is a bearish candle.
These are generally red in colour.
Bearish candles represent a situation where the bears bring down the prices to a small extent in spite of being unable to dominate the market.
Bearish candles found on top of uptrends may indicate a potential bearish reversal.
Doji spinning top candle pattern
This pattern indicates market indecision. It is characterized by a small body with long upper and lower shadows, showing that both bulls and bears were active during the trading session but neither side was able to gain significant control. The small body reflects a close near the opening price, suggesting equilibrium between buyers and sellers.
The pattern is a variation of the traditional Doji, where the open and close are almost equal. However, in the Spinning Top, the shadows (or wicks) are more prominent, indicating volatility and indecision at key points. Traders often interpret this pattern as a potential reversal signal when it occurs at the top of an uptrend or the bottom of a downtrend.
In an uptrend, the Doji Spinning Top suggests that bullish momentum is weakening, and a reversal may be on the horizon. In a downtrend, it hints that bearish pressure is losing strength, signaling a possible upward move. However, traders usually wait for confirmation in the following candles before taking action, as the Doji Spinning Top alone doesn’t guarantee a trend change.
Therefore, in essence, it acts as a red flag for areas of caution with potential reversal points in the market and is used to assist technical analysis and decision-making.
Trading strategies
The following candle after the spinning top is crucial in indicating market trends. Understanding market trends will help you make more money, both when investing and trading in equity.
Bullish traders can take their positions when the spinning top candle appears after a downtrend, and the reversal is confirmed by the following candle.
Stop loss point – The lowest price point of the spinning top candle.
Entering the long position – When prices exceed the highest price point of the spinning top candle.
Bearish traders can go short when the spinning top candle appears after an uptrend, and the following candle confirms the reversal.
Stop loss point – The highest point of the spinning top candle.
Entering the short position – Based on the tip of the lower wick.
Case study
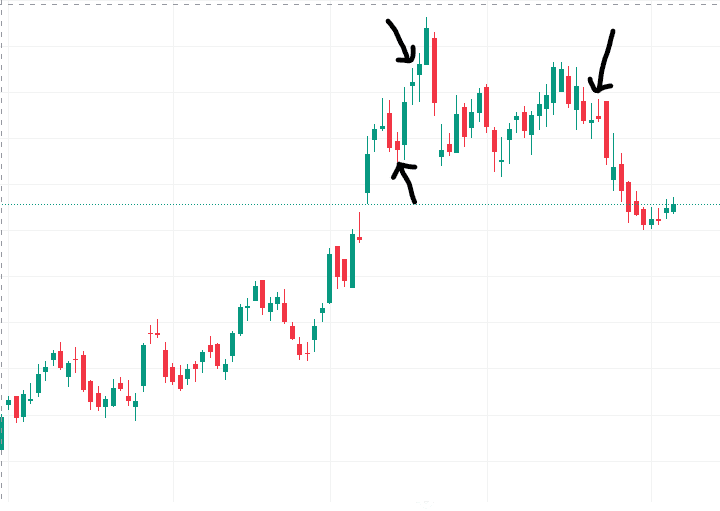
Below is a sample of the monthly candlestick chart of Reliance Industries.
The arrows point to spinning top candlesticks.
You may notice that the spinning top candles can form at the top and the bottom of the charts.
While one of them shows a reversal, the others do not.

Bottomline
The spinning top candlesticks form when the market is indecisive. The market, not following a particular trend is quite a regular scenario. It leads to the frequent appearance of the spinning top candle on the candlestick charts.
The spinning top pattern, as an individual tool, is not very useful. Combining it with other technical indicators may give better results while analysing market trends.
Also Read: What do these symmetrical triangle patterns suggest?
The spinning top candle looks similar to a doji candle. However, the doji candle has a thinner body and smaller wicks as compared to the size of the spinning top candle.
It requires regular practice to differentiate the spinning top from other candles and use it as a tool for technical analysis.

