New-age India has a different take on money-making practices. Perhaps, it is one of the reasons why a number of Indian investors are taking baby steps in the stock market arena.
However, many of them seem to enter this world with half-baked knowledge. No wonder many of them are not getting the expected returns. Does studying the market completely allow you to earn more?
Seven analysis tools to become a confident trader
Evaluating stock market performance is significant in assessing your overall success. Different tools of technical analysis help you to make better trading decisions. Also, it shows you the practical ways and prevents you from going through emotions.
Many updated stock market analysis tools help you place sell-and-buy indications that help discover new trading potentials.
But not all tools proved to be the potential stock analysis tool. If it is your first time trying technical analysis tools, then you have to have a look at some basic tools.
1. Screener Plus
A brainchild of Charles Schwab, Screener Plus is a standard trading platform and one of the leading tools for technical analysis. It utilises real-time and streamed data.
You can use it as a client to filter the ETFs and equities. They make the study utilising different practical and essential criteria. Moreover, it adds specialised signs of Recognise, another premier tool for technical analysis.
Often, dealers use Screener Plus to define the limits that relate perfectly to their services. Additionally, technologies like pattern recognition come with the customised StreetSmart edge.
2. Thinkorswim
Thinkorswim is a sophisticated, option-oriented platform. As a trader, you can use this stock analysis tool to personalise it with your preferred tools. The makers had the needs of options traders in mind while creating it—no wonder it amalgamates various analytical tools which would cater to the traders in equities.
For example, it has various drawing tools, technical indicators and even tools for data visualisation. As a trader, you can customise your analytical tools using Thinkorswim. It also has an inbuilt scripting language, thinkScript.
Moreover, it has a potential version for web, windows, and mobile applications. No matter what you choose, they come with real-time data for streaming. Though presently, Charles Schwab is in the process of acquiring TD Ameritrade’s company.
3. Active Trader Pro
Fidelity’s digital transaction platform has an impressive collection of useful features. You would not find them on its company website. For example, you can use its customised tools and charts for trading. And if you have any interest in the stocks, this technical analysis software will send you technical indications regularly.
Fidelity also blends the technical patterns of Recognia. On its official website, the advanced techniques of charting would allow you to check the stock data that goes back to the early eighties. Imagine how helpful they can be, particularly when you can combine them with as many as 60 fully configurable technical signages.
Even if that does not sound attractive enough, you should know that the study centre of Fidelity has all articles, videos, infographics, recorded webinars, and live interactive webinars.
Also Read: What is a roadshow in IPO?
4. Slope of Hope
Slope of Hope is one of the biggest hubs to trade ideas; one of the remarkable aspects of this advanced technical analysis platform is that it offers an array of helpful features absolutely free!
And just because they do not cost a rupee does not mean they are any less functional. With exclusive features like SlopeCharts and SlopeRules, it offers a trading system that suits investors, irrespective of their compatibility. Moreover, you enjoy free tips to season yourself more as a trader.
The app that it has is ideal for both iOS and Android devices. And after availing of the plethora of free services it offers, you can get all its contents for a reasonable subscription. No wonder it is hardly going to be a regrettable investment.
5. Interactive Brokers
Are flagship platforms like Interactive Brokers worth a try? When looking for tools for brokers, IB is the one that thousands count on. And they have many reasons to do so.
One of the primary reasons is the fully configurable charting that it comes with. Additionally, there is an array of live flow data and indicators. Speaking of indicators, it has integrated programs like Trader Workstation (TWS), which is well known for its capability of technical analysis.
You can utilise all the 120 + indicators, and over three decades of information it comes with. Even if you are not yet ready to have a paid service of trading analysis software, there is always a chance to use its free trial edition. It has sufficient content to help you navigate through the stock market successfully.
6. Stochastic Oscillator
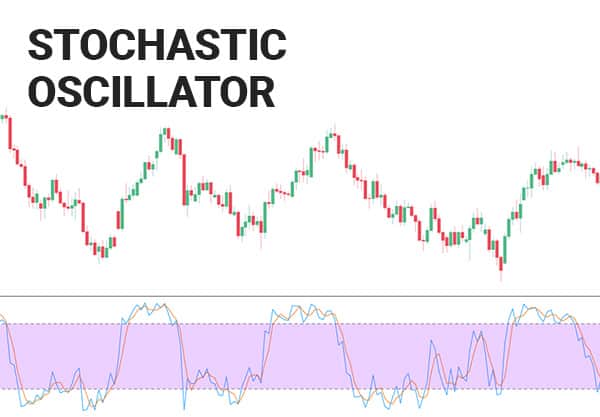
In this volatile world of the Indian stock market, it is important to have the help of technical analysis tools to understand the market trends well. It can be helpful to know purchase as well as sell signals. So as one of the oldest stock market tools, Stochastic Oscillator is still going strong for a good number of reasons.
What George Lane created back in the 1950s is still the first choice of many traders. It can help you to manage the position of your trading effectively and help you protect the assets whenever the market is oversold and overbought.
7. Parabolic SAR
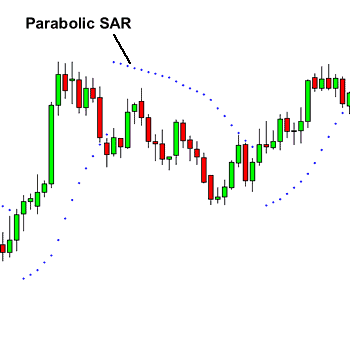
As a trader, you can use Parabolic SAR to identify the most powerful points of reversal, especially in the asset’s price. You can get all the help from it to figure out the changing trends, or Wagner, the prevailing trend is strong enough or losing its strength. When you use other tools with Parabolic SAR, managing risks becomes easier.
What Is Technical Analysis?
Technical analysis is a method used by traders and investors to study past price movements and trading volumes to predict future stock price trends. Instead of focusing on a company’s financial statements or business performance, technical analysis focuses on market data such as price charts, patterns, and indicators.
The basic idea behind technical analysis is that stock prices move in trends and historical price patterns tend to repeat over time. By analysing these patterns, traders try to identify opportunities to buy or sell stocks.
Technical analysis mainly relies on tools such as:
- Price charts
- Trend lines
- Support and resistance levels
- Technical indicators
For example, if a stock has repeatedly bounced from a certain price level in the past, traders may consider that level as support. Similarly, if a stock struggles to move above a particular price, it is often seen as a resistance level.
Technical analysis is widely used for short-term trading, swing trading, and intraday trading, where timing the market becomes important.
Moving Average (MA)
A Moving Average (MA) is one of the most commonly used indicators in technical analysis. It helps traders understand the overall trend of a stock by smoothing out short-term price fluctuations.
Instead of focusing on daily price changes, the moving average calculates the average price of a stock over a specific number of days.
For example:
- 20-day Moving Average shows the average closing price of the last 20 days
- 50-day Moving Average represents the average price over the last 50 days
- 200-day Moving Average reflects the long-term trend of a stock
Traders use moving averages to identify trends:
- If the stock price is above the moving average, it often indicates an uptrend.
- If the stock price is below the moving average, it may signal a downtrend.
There are two main types of moving averages:
Simple Moving Average (SMA): This calculates the average of closing prices over a specific period.
Exponential Moving Average (EMA): This gives more weight to recent prices, making it more responsive to current market movements.
Moving averages are also used to generate trading signals. For example, when a short-term moving average crosses above a long-term moving average, it may signal a potential buying opportunity. When it crosses below, it may indicate a possible selling signal.
Because of its simplicity and effectiveness, the moving average is one of the most widely used indicators in technical analysis.
Final thoughts
There are many other tools for technical analysis that modern Indian traders are regularly using. These tools undoubtedly offer valuable resources to help you make well-informed decisions before any investment.
Analysis of market trends and price action can help you get all the important insights into the nature of various stocks. Accordingly, you can make near-accurate predictions of the possible movements in the future.
Nevertheless, as an investor, you should understand that using such tools relies upon a foolproof way. It always makes sense to utilise it with other methods of analysis and research on the market before making any decision.