
What Is the Parabolic SAR Indicator?
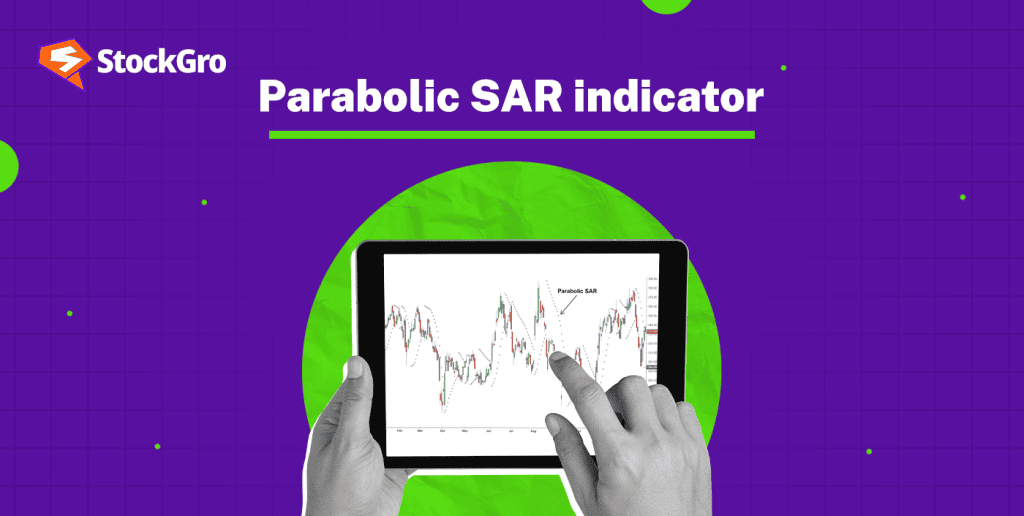
The Parabolic SAR (Stop and Reverse) is a trend-following technical indicator developed by J. Welles Wilder to identify the direction of a trend and potential reversal points. It is represented on charts as a series of dots placed either above or below the price, depending on the trend direction. When the dots are below the price, it indicates an uptrend; when they are above, it signals a downtrend.
The primary purpose of the Parabolic SAR is to help traders determine entry, exit, and trailing stop levels. It is particularly useful in trending markets, where it visually tracks price movement and adjusts dynamically as the trend progresses.
Unlike momentum indicators such as the RSI indicator, which measure strength, Parabolic SAR focuses on trend direction and reversal timing, making it a complementary tool in technical analysis.
How Parabolic SAR Works
The Parabolic SAR works by plotting dots that move closer to price as the trend continues. When the price trend reverses, the dots switch sides, indicating a possible trend reversal signal. This “stop and reverse” mechanism helps traders quickly adjust their positions.
The calculation of Parabolic SAR is based on two key components:
- EP (Extreme Point): The highest high in an uptrend or lowest low in a downtrend
- AF (Acceleration Factor): A value that increases as the trend continues
Formula:

As the trend continues, the acceleration factor increases, causing the SAR value to move closer to price. This tightening effect helps lock in profits and reduce risk exposure.
How to Use the Parabolic SAR Indicator
Traders use the Parabolic SAR to identify trend direction, entry points, and exit signals. When the dots flip from above to below price, it signals a potential buying opportunity. Conversely, when the dots move from below to above price, it indicates a possible selling opportunity.
The indicator is also widely used for setting trailing stop-loss levels. As the dots move closer to price during a trend, traders can use them as dynamic stop levels to protect profits.
However, Parabolic SAR works best when combined with other indicators such as the RSI indicator or moving averages. This combination helps filter out false signals and improves trade accuracy.
When Can Parabolic SAR Be Used?
Parabolic SAR is most effective when the market is in a clear trending phase, either upward or downward. It helps traders stay in a trend and exit when momentum starts to weaken.
It is also useful for identifying trend reversals, especially when combined with other confirmation tools. Traders often use it to time entries after confirming signals from other indicators.
However, in sideways or choppy markets, the indicator may generate frequent false signals. Therefore, understanding market conditions is crucial before relying on it.
Best Markets for Using Parabolic SAR Effectively
- Strong Trending Markets (Uptrend or Downtrend):
Parabolic SAR works best when the market is clearly trending in one direction. In such conditions, the dots consistently stay on one side of the price, providing reliable signals. This helps traders stay in the trend and capture larger moves. - Equity Stocks with Clear Momentum:
Stocks that show sustained price movement with higher highs or lower lows are ideal for Parabolic SAR. Momentum-driven stocks reduce the chances of false signals. This makes it easier to follow trend-based entries and exits. - Index Trading (Nifty, Bank Nifty, etc.):
Indices often exhibit directional moves, especially during trending phases. Parabolic SAR can help identify trend continuation and reversal points effectively. It is widely used in both swing and intraday index trading. - Intraday Trending Sessions:
On days when the market shows strong directional movement, Parabolic SAR performs well in intraday charts. It helps traders ride trends and exit positions efficiently. However, it should be avoided during choppy sessions. - Commodity and Forex Markets:
These markets often display extended trends due to macroeconomic factors. Parabolic SAR can effectively track these trends and provide timely exit signals. It is particularly useful in volatile trending conditions. - Breakout Markets:
When price breaks out of a consolidation zone and starts trending, Parabolic SAR can help capture the move. The indicator adjusts quickly to the new trend direction. This makes it useful for breakout traders. - Markets with High Liquidity:
Highly liquid markets tend to have smoother price movements. This reduces noise and improves the accuracy of Parabolic SAR signals. Liquid stocks and indices are therefore more suitable. - Swing Trading Setups:
Parabolic SAR is effective for holding trades over a few days to weeks in trending markets. It helps trail stops and lock in profits as the trend progresses. This makes it suitable for swing traders.
Indicators That Complement Parabolic SAR
- RSI (Relative Strength Index):
The RSI helps identify overbought and oversold conditions, which adds context to Parabolic SAR signals. For example, a SAR buy signal combined with RSI rising from oversold levels strengthens the trade setup. It helps filter false reversals. - Moving Averages (20 EMA, 50 EMA, 200 DMA):
Moving averages confirm the overall trend direction. If Parabolic SAR signals align with the trend indicated by moving averages, the probability of success increases. They also act as dynamic support and resistance. - MACD (Moving Average Convergence Divergence):
MACD helps confirm momentum and trend strength. A bullish crossover along with a SAR buy signal provides stronger confirmation. It reduces the chances of entering weak trends. - Volume Indicators (OBV, Volume Spikes):
Volume indicator confirms the strength behind price movements. A SAR signal supported by increasing volume indicates strong participation. This makes the signal more reliable. - Bollinger Bands:
Bollinger Bands help identify volatility and price extremes. When SAR signals occur near band breakouts or squeezes, it adds confidence to the trade. It is useful for timing entries. - Support and Resistance Levels:
Key price levels help validate SAR signals. A reversal signal near strong support or resistance is more reliable. This improves trade accuracy and risk management. - ADX (Average Directional Index):
ADX measures trend strength. When ADX is above 25, it confirms a strong trend, making SAR signals more effective. It helps avoid trading in weak or sideways markets. - Stochastic Oscillator:
The stochastic oscillator identifies momentum shifts and overbought/oversold zones. When used with SAR, it helps refine entry and exit timing. It adds an extra layer of confirmation.
Advantages of the Parabolic SAR
- Clear Buy and Sell Signals:
The Parabolic SAR provides straightforward signals when the dots switch from above to below price or vice versa. This makes it easy for traders to identify potential entry and exit points without complex analysis. - Effective in Trending Markets:
It performs best in strong uptrends or downtrends, helping traders stay in a trade as long as the trend continues. This makes it useful for capturing sustained price movements. - Acts as a Trailing Stop-Loss Tool:
The indicator dynamically adjusts with price movement, allowing traders to use it as a trailing stop. This helps lock in profits while minimizing downside risk. - Simple and Beginner-Friendly:
Its visual representation makes it easy to understand and apply, even for beginners. Traders can quickly interpret signals without deep technical expertise. - Helps Identify Trend Reversals:
When the dots flip position, it signals a potential trend reversal. This allows traders to exit or reverse positions early.
Disadvantages of the Parabolic SAR
- Generates False Signals in Sideways Markets:
In range-bound or choppy markets, the indicator can frequently switch positions, leading to multiple false signals. This can result in unnecessary trades and losses. - Does Not Measure Momentum:
The Parabolic SAR focuses only on price direction, not strength. It does not indicate whether a trend is strong or weak, limiting its standalone effectiveness. - Lagging Nature in Reversals:
Although it signals reversals, it may do so after the move has already begun. This can reduce profit potential or lead to delayed entries. - Requires Confirmation from Other Indicators:
Using it alone can be risky, as it may not always provide reliable signals. Traders often need to combine it with tools like RSI or moving averages for better accuracy. - Not Ideal for All Market Conditions:
It works best in trending markets but struggles in volatile or low-direction environments. This limits its universal applicability across all trading scenarios.
Bottom Line
The Parabolic SAR is a powerful trend-following tool that helps traders identify trend direction, entry points, and potential reversals. Its simplicity and visual clarity make it a popular choice among both beginners and experienced traders.
However, its effectiveness depends on market conditions. It performs best in trending markets and should be combined with other indicators for improved accuracy.
When used correctly with tools like the RSI indicator and proper risk management, the Parabolic SAR can become an essential part of a trader’s technical analysis toolkit.
FAQs
Yes, beginners can use the Parabolic SAR because it is simple and visually easy to understand. However, combining it with other indicators improves accuracy.
Yes, it provides signals when dots switch from above to below price (buy) or below to above price (sell). These signals indicate potential trend reversals.
Yes, it can be used for intraday trading, especially in trending markets. However, traders should confirm signals with other indicators.
Yes, it is designed to indicate potential trend reversals when the dots flip position. However, confirmation from other tools is recommended for accuracy.