
Summary
This blog explains what R-squared means and how it helps investors understand whether an asset is actually moving in line with its benchmark index. It looks at why R-squared matters, and how it works alongside metrics such as alpha, beta, Sharpe Ratio, and standard deviation, and how it can help you judge performance more accurately.
Numbers on a financial report can feel like a foreign language at first. Most stock market investors look at returns and move on. But if you want to know whether those numbers are actually telling you something useful, there is one metric that deserves your attention. The R-squared. It does not grade an asset’s performance. What it does is add clarity to the comparison you are drawing.
What Is R-Squared in Stock market?
R-squared (R²) is a statistical measure that shows how much of an asset’s movement can be attributed to changes in its benchmark index. It is reported as a decimal between 0 and 1, and often expressed as a percentage between 0% and 100%
Here is how the range reads in investment analysis:
- 0% to 40%: Low correlation. The asset’s movement is largely independent of the benchmark.
- 40% to 70%: Moderate correlation. Some alignment exists, but the strategy has distinct characteristics.
- 70% to 100%: High correlation. The investment is tracking its benchmark closely.
The formula behind it is:
R² = 1 − (Unexplained Variation / Total Variation)
Where unexplained variation is the portion of return changes that the benchmark cannot account for, and total variation is the full spread of the fund’s historical return changes.
Why R-Squared Matters for Investors & Traders
Whether you are dealing with mutual funds, stocks or any other asset classes, R-squared helps you track the different segments of the stock market. Here is why it matters:
- Valid benchmark comparison
A large-cap fund with an R² of 30 being judged against the Nifty 50 is not a fair comparison. The fund barely correlates with that index. Whatever returns it generated had little to do with Nifty 50 movements. - Management approach distinction
A large-cap fund with R² above 90 is essentially mirroring the index while charging active fees. As per Securities and Exchange Board of India (SEBI) guidelines, all fund houses must declare a specific benchmark for every scheme, making R² a natural follow-up question. - Style drift detection
Suppose a mid-cap fund starts showing a very high R² against a broad market index over time. That is a quiet signal that the fund’s portfolio may have shifted character, even if no formal announcement was made. - Gives beta its context
Beta on its own measures how volatile a fund is relative to its benchmark. But a beta reading on a fund with low R² is unreliable.
A high R² with a high beta tells you the asset is market-aligned but more volatile. A high R² with low beta suggests it tracks the market while taking on less risk.
R-Squared vs Other Key Investment Metrics
R-squared does not operate in isolation. Here is how it sits alongside the other metrics most investors already use.
| Metric | What It Measures | Key Insight |
| R-squared | Correlation with benchmark | Whether the benchmark comparison is valid |
| Alpha | Excess return over benchmark (risk-adjusted) | Fund manager’s actual contribution |
| Beta | Volatility relative to benchmark | Sensitivity to market movements |
| Sharpe Ratio | Return earned per unit of risk taken | Overall risk-adjusted efficiency |
| Standard Deviation | How much returns vary over time | Consistency and predictability |
- R-squared: A high R² makes all other benchmark-linked metrics more meaningful. A low R² means those metrics need to be read with caution.
- Alpha: Strong alpha on a low R² asset is worth questioning. The outperformance may look significant, but it could be measuring the wrong benchmark entirely.
- Beta: Beta without R² is a half-read sentence. If R² sits below 40, the beta reading carries little predictive weight regardless of what it shows.
- Sharpe Ratio: A high Sharpe with low R² means the asset is efficient but moves independently of the broader market. That can be a feature, not a flaw, depending on what the investor needs.
- Standard Deviation: R² and standard deviation together help distinguish between an asset that is volatile because of the market and one that is volatile for entirely different reasons.
Real-Life Scenarios of R-Squared in Action
Numbers make more sense with a story behind them. Here are two situations where R-squared changed what the data actually meant.
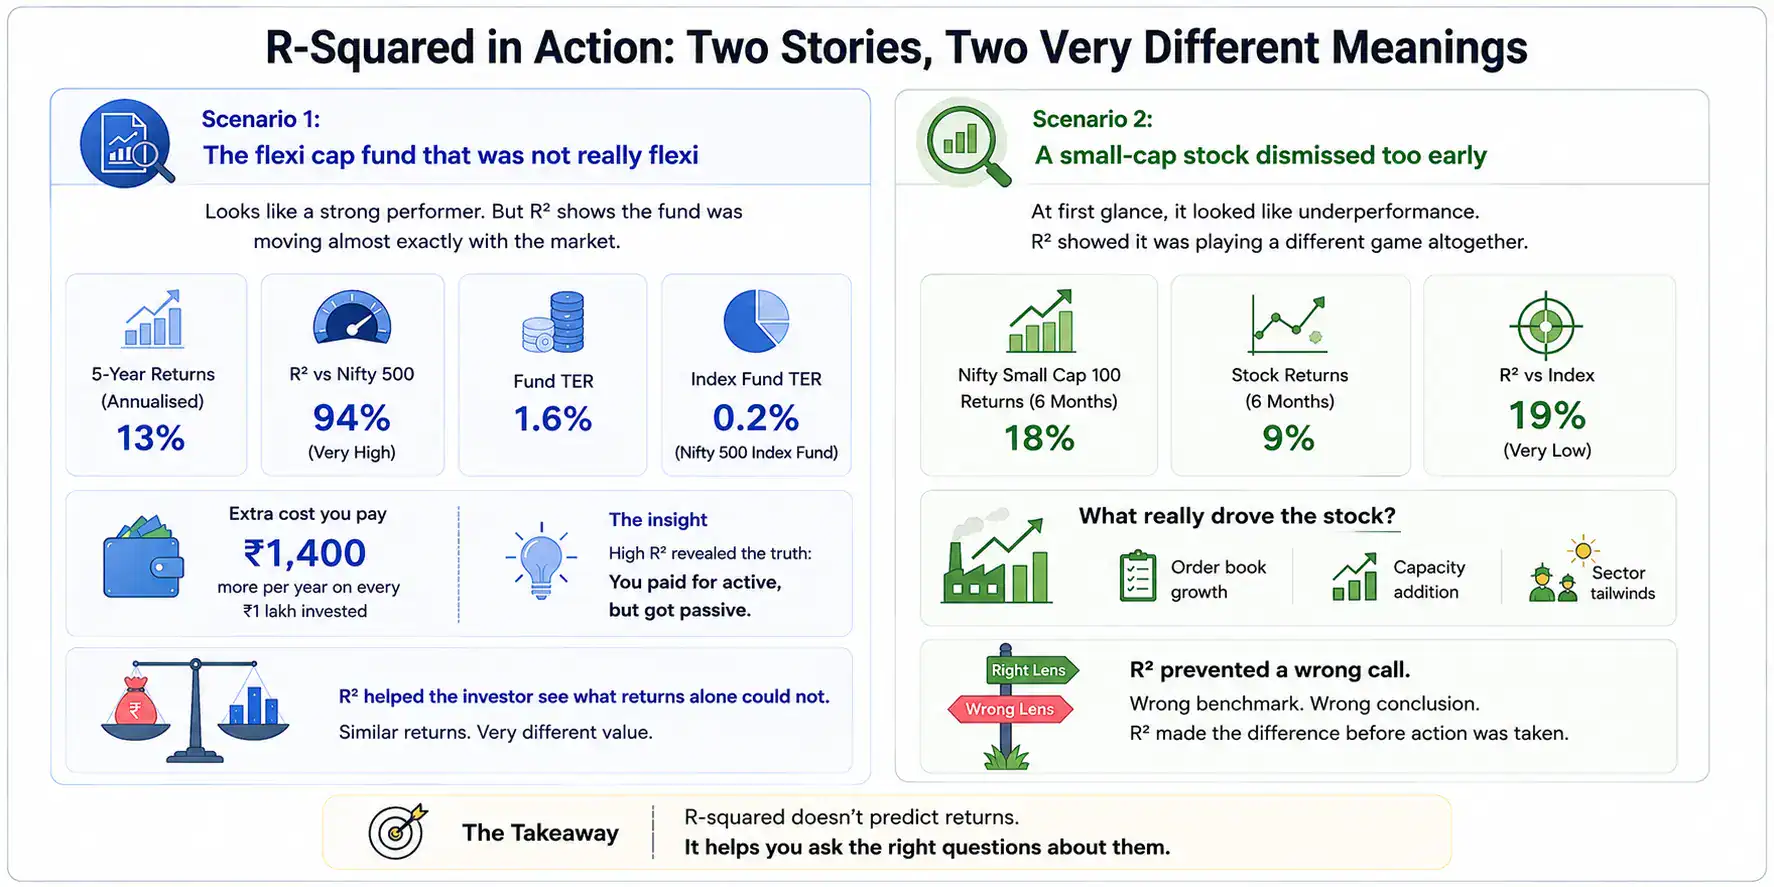
Scenario 1: The flexi cap fund that was not really flexi
An investor is reviewing a flexi cap fund that has delivered 13% annualised returns over five years. Impressive on the surface. But the mutual fund‘s R² against the Nifty 500 sits at 94. Nearly every move this fund made was already being made by the index. The fund manager’s active calls contributed almost nothing to the outcome.
A Nifty 500 index fund delivering similar returns over the same period carried a total expense ratio (TER) of 0.2% against the flexi cap’s 1.6%. The investor was paying ₹1,400 extra annually on every ₹1 lakh invested for a level of active management that R² revealed was barely there.
Scenario 2: A small-cap stock dismissed too early
A trader is tracking a small-cap manufacturing stock. Over six months, the broader Nifty Small Cap 100 index gained 18% while the stock returned only 9%. The obvious read is underperformance. But the stock’s R² against the index is 19, meaning the index’s movement explains almost none of what this stock does.
The stock was responding to its own order book growth, capacity additions and sector-specific tailwinds entirely unrelated to the index. Judging it against the Nifty Small Cap 100 was the wrong lens from the start. R-squared made that visible before the trader acted on a flawed conclusion.
How Traders Use R-Squared in Strategy Building
R-squared is not just for evaluating funds sitting in a portfolio. For traders, it actively shapes how positions are built, hedged and reviewed.
- Diversification check
Two holdings, both showing R² above 90 against the same index, are essentially in the same position. True diversification across a portfolio requires meaningful spread in R² values, not just across fund names. - Hedging accuracy
Before using a derivative contract to hedge a portfolio, R² helps confirm whether that hedge will actually work. A portfolio with R² of 30 against the Nifty will remain largely exposed even with index derivatives in place. - Model validation in algo trading
In quantitative strategies, R² tests how well a regression model fits market data. A model with R² below 40 is a weak predictor and should not have capital behind it. - Reading momentum signals
When a stock’s R² against its sector index drops suddenly, it often signals something company-specific driving the price rather than broader sector momentum. That is a cue to investigate before acting on a trend.
Common Misconceptions About R-Squared
R-squared is simple enough to be misread with confidence, which is why these misunderstandings come up more often than you would expect.
- High R² equals good performance: It absolutely does not. An asset can have an R² of 97 and still lose money if its benchmark drops. R-squared measures correlation, not quality of returns.
- Low R² signals a problem: A sector fund or a thematic strategy is designed to diverge from broad market indices. Low R² in that context is not a warning; it is the fund working as intended.
- R² is a fixed number: It shifts across different market phases. A fund’s R² measured during a bull market may look quite different after a prolonged correction. Checking it across multiple windows gives a cleaner picture.
- A high R² confirms the benchmark is correct: A mid-cap fund can show a high R² against the Nifty 50, which does not validate the comparison. The benchmark needs to fit the fund’s stated mandate first.
Benefits of Learning R-Squared for Smarter Investing
Once you understand R², it quietly improves several other parts of how you read and build a portfolio.
- Calibrating return expectations: An asset with low R² against a popular index will naturally behave differently from it. Knowing this upfront prevents disappointment when the numbers do not line up.
- Cost-conscious allocation: When an actively managed fund shows near-index-level R², that is useful to determine if the management fees are justified or to opt for a low-cost alternative.
- Smarter portfolio construction: R² helps ensure holdings are complementary. Two assets with contrasting R² profiles are likely to respond differently to market conditions than two with identical benchmark correlation.
- Sharpens due diligence: R² stops investors from over-relying on any single metric by first establishing whether the benchmark relationship is strong enough for other numbers to carry weight.
Conclusion
R-squared will not tell you which investment to make. It will tell you whether your analysis is sitting on firm ground. Most investing mistakes are not about picking the wrong option; they are about drawing the wrong conclusion from the right investment opportunity. R-squared helps close that gap. Use it alongside alpha, beta and the Sharpe Ratio, and the picture of any portfolio becomes considerably more honest.
FAQs
- Is a high R-squared good or bad for investors?
A high R-squared is neither automatically good nor bad. It simply shows how closely an investment’s movement aligns with its chosen benchmark. - How is R-squared different from beta in stocks?
Beta measures how volatile a stock is compared to its benchmark, while R-squared shows whether that benchmark comparison is statistically reliable in the first place. - Can R-squared predict stock returns or performance?
No, R-squared cannot predict future returns. It only measures how strongly an asset’s past price movements aligned with its benchmark index. - What is a good R-squared value for mutual funds?
For actively managed funds, an R-squared between 40 and 70 is often considered healthy because it reflects independent investment decisions. For index funds, values above 90 are generally preferred as they indicate close benchmark tracking.
How do traders use R-squared in real strategies?
Traders use R-squared to evaluate diversification, validate hedging strategies, test trading models, and identify whether price movements are market-driven or company-specific.