
When considering an investment, you would naturally look at the risk and the return potential of the investment. Similarly, other investors in the market would also have different preferences related to risk and return.
To understand the big picture in the market, we combine everyone’s investment preferences. This assists us in determining the justifiable compensation for assuming investment risk. The security market line (SML) is an effective tool for this objective. It shows us the expected return for any investment, given its risk level.
Intrigued about its functioning? Stay with me, and I’ll explain how the security market line enables investors to make knowledgeable choices!
What is the security market line?
In the financial world, there are two categories of risk: systematic and unsystematic. Systematic risk, also known as market risk, is a form of risk that impacts the entire market and cannot be mitigated through diversification.
Conversely, unsystematic risk can be reduced by portfolio diversification as it is unique to each security.
But what is the security market line?
The security market line (SML) essentially serves as a graphical depiction of the Capital Asset Pricing Model (CAPM). It illustrates the relationship between a security’s expected return and its systematic risk, which is measured by beta.
Imagine a graph where we plot securities to see their risk versus their potential reward. The Security Market Line is the line that runs through this graph.
The horizontal axis (x-axis) shows the security’s beta, which tells us how much the security’s returns move compared to the market. The vertical axis (y-axis) indicates the expected return, which is what investors hope to earn from the security.
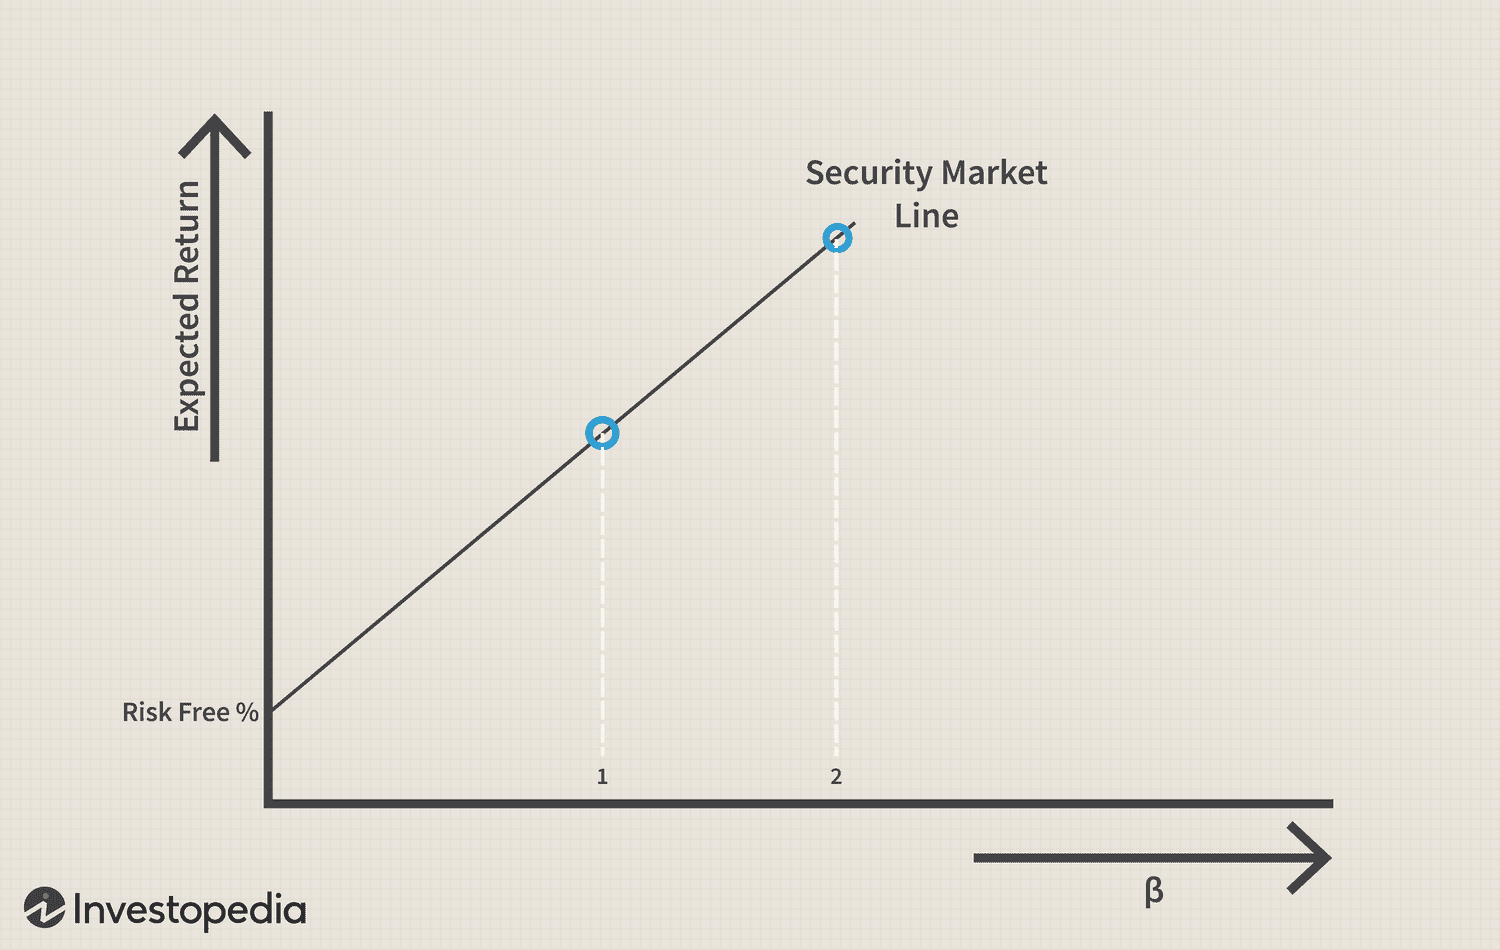
Lastly, the market risk premium, which is the additional return investors seek for assuming higher risk, is ascertained by its position on the graph relative to the Security Market Line.
In essence, the Security Market Line helps investors figure out if a security is a good deal based on its risk and return.
Assumptions about SML
Here are some assumptions of Security Market Line:
- Every investor in the market accepts the prevailing prices and cannot influence the pricing of securities.
- The practice of short-selling securities is not permitted.
- The timeframe for investment considerations is uniform across all investors.
- There exists a singular asset that is deemed risk-free.
- All individuals participating in the market act rationally, making decisions based on available information.
Security market line formula
The security market line equation is as follows:
E(Ri) = Rf + βi [E(Rm) – Rf];
Here,
E(Ri): Expected return on investment is the average return an investor anticipates earning from an investment.
(Rf): This is the risk-free rate.
βi is the beta- This measures the risk an investment carries in relation to the overall market.
E(Rm) is the expected market return, and
E(Rm) – Rf is the market risk premium.
How do you read a security market line?
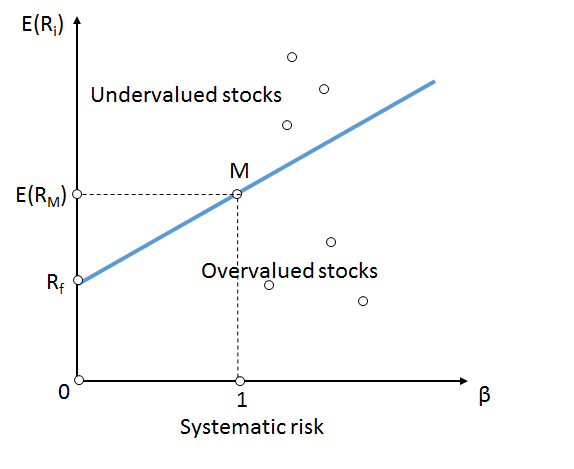
The Security Market Line is used by investors and managers of mutual funds for screening potential assets in their portfolios that lie within the expected return on risk boundaries. In simple terms, it is used to find whether the stocks near the security market line are undervalued and overvalued.
If a security’s position on the Security Market Line chart is above the line, it’s deemed to be underpriced/undervalued. This indicates that its risk-adjusted return is higher than was initially expected, given the inherent risks.
Conversely, those below it are regarded as overvalued, denoting that their anticipated returns do not adequately compensate for all risks involved.
It helps investors weigh two similar securities with the same returns and determine which has less market risk or expectation of return.
Capital Market Line Vs Security Market Line
The capital market line and the security market line are two different concepts. Here are a few differences:
| Comparison Attribute | Capital Market Line (CML) | Security Market Line (SML) |
| Meaning | CML shows the rates of return for a specific portfolio | SML relates individual assets to the market’s risk and return. |
| Risk Measures | The standard deviation of returns (total risk) | Systematic risk (beta) |
| Risk-return trade-off | Evaluates for a single asset | Constructs optimal investment portfolios with different risk levels. |
Bottomline
The security market line (SML) is an indispensable instrument in the financial world that assists investors in making knowledgeable choices by showcasing the correlation between a security’s projected return and its systematic risk.
It facilitates the evaluation of a security’s pricing, whether undervalued or overvalued, based on its risk and return. Fundamentally, the Security Market Line acts as a navigational tool, steering investors through the intricate terrain of investment risk and return.
FAQ’s
The Security Market Line (SML) graphs the required rate of return against beta (β), which represents systematic risk. Beta measures how sensitive a stock is to movements in the overall market. In the SML framework, higher beta means higher risk, and investors therefore expect a higher return as compensation for taking that additional risk.
The Security Market Line shows a positive relationship between expected return and beta. This means that as beta increases, the expected return of a security also increases. Investors demand higher returns for taking higher systematic risk. The relationship is derived from the Capital Asset Pricing Model (CAPM) and is typically expressed as:
Expected Return = Risk-Free Rate + Beta × (Market Return − Risk-Free Rate)
This formula shows that a stock’s expected return depends on the risk-free rate, the overall market return, and the stock’s beta.