Traditional moving averages often fail to keep up when markets switch between sideways moves and sharp price moves. They either react too slowly or generate noise during calm periods. This is where the adaptive moving average is of assistance. Designed to adjust itself based on market conditions, it becomes more responsive in active phases and smoother during quiet ones. In this blog, we’ll break down what the Adaptive Moving Average (AMA) is, how it works, and how to use it the right way.
What is the Adaptive Moving Average?
The adaptive moving average (AMA) is a technical indicator that adjusts itself based on how much the price is moving. Instead of using a fixed formula, it adapts to price changes to stay more responsive during fast moves and smoother during quiet periods. AMA is commonly used with other indicators to track price direction or identify changes in price behavior.
How Does the Adaptive Moving Average Work?
AMA appears as a line on the chart and adapts its movement depending on how volatile the market is. When price movement is small and steady, AMA stays close to the price. During wide swings, it moves more gradually. This makes it useful for spotting where prices may find support or resistance. Traders look at its direction and its position relative to price. For example, when prices stay above a rising AMA, it may suggest strong upward behaviour. If prices fall below a declining AMA, it may reflect broader weakness in price action.
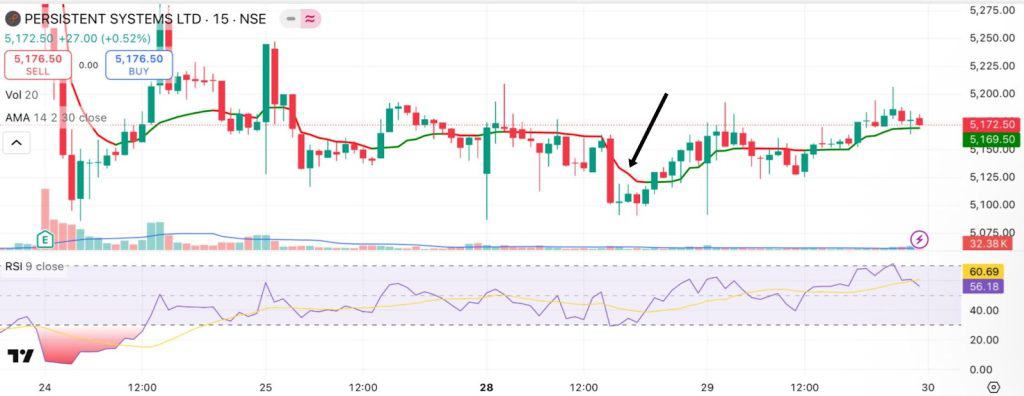
For example, in the 15-minute chart of Persistent Systems Ltd’s below from July 28–29, a drop is followed by a price bounce that lifts above the AMA. The line’s turn from red to green signals how the indicator adjusts to changing market conditions in real time.
Who Developed the Adaptive Moving Average?
The adaptive moving average was created by Perry J. Kaufman in 1998 to adjust for noisy market behaviour. It tracks prices closely during calm phases and pulls back during high movement. Kaufman introduced it in his book Trading Systems and Methods, after years of research starting in 1972. The method filters erratic moves without delaying too much during active phases.
Adaptive Moving Average Formula
The Adaptive Moving Average (AMA) adjusts its value based on how steadily price has moved over a selected period. It starts by calculating an Efficiency Ratio (ER), which measures the directness of price movement. This ER is then used to create a smoothing constant (SC) that decides how quickly the AMA should respond. The updated value is calculated using the formula:
AMA today = AMA yesterday + SC × (Price today – AMA yesterday)
This structure allows the AMA to adapt in both calm and active markets.
How to Calculate the Adaptive Moving Average
The AMA adjusts itself using two values: the Efficiency Ratio (ER), which measures how directly the price moved (less noise = higher ER), and the Smoothing Constant (SC), which controls how quickly the AMA reacts. A high ER makes the AMA react faster; a low ER slows it down.
Lets take an example to understand better, suppose XYZ stock moved from ₹100 to ₹110 over 10 days.
- Net change = ₹10
- Sum of daily moves = ₹14
- ER = 10 ÷ 14 = 0.71
Now,
- Fast SC = 2 ÷ (2+1) = 0.667
- Slow SC = 2 ÷ (30+1) = 0.0645
- SC = (0.71 × (0.667 − 0.0645)) + 0.0645 = 0.4945
Lastly, applying the AMA formula,
- Yesterday’s AMA = ₹108, today’s price = ₹110
- AMA = 108 + 0.4945 × (110 − 108) = ₹108.99
This calculation helps AMA adjust to both direction and stability in price.
Adaptive Moving Average vs Exponential Moving Average
The AMA and the exponential moving average both track price movements, but they react differently. Here’s how they differ:
| Feature | Adaptive moving average (AMA) | Exponential moving average (EMA) |
| Smoothing factor | Changes based on price movement | Fixed, based on a set period |
| Responsiveness | Speeds up in clean moves, slows in noisy moves | Same speed all the time |
Adaptive Moving Average vs Simple Moving Average
While the AMA and the simple moving average both smooth out price data, they do so in different ways. Here’s how they compare:
| Feature | Adaptive moving average (AMA) | Simple moving average (SMA) |
| Weighting of prices | Focuses more on recent prices | Treats all prices the same |
| Responsiveness | Adjusts based on price behavior | Slower due to equal treatment |
Best Settings for Adaptive Moving Average
The AMA uses three main inputs that control how it reacts to price movement.
- Period (n): This sets how many past price points the AMA uses to calculate its responsiveness. A typical value is 10. It helps the AMA judge whether price movement is smooth and consistent or erratic and choppy.
- Fast: This controls how quickly the AMA reacts during sharp price moves. A common setting is 2, allowing the AMA to stay closer to price when movement is strong and clear.
- Slow: This controls how much the AMA slows down during quieter phases. A usual setting is 30, which helps the line stay smooth and avoid reacting to random short-term fluctuations.
How to Use the AMA in Trading
The AMA can be used in multiple ways to read price behavior more clearly while performing technical analysis in trading.
- Trend identification: A rising AMA reflects steadily increasing prices; a falling one shows prices have been moving lower. A flat line points to sideways movement.
- Crossover signals: When the price closes above the AMA, it may suggest upward strength. A close below the line can signal weakening prices.
- Dynamic support and resistance: The AMA can act like a soft barrier where prices pause or bounce. In rising markets, prices may pull back to the AMA before continuing upward.
- Filtering market noise: During unstable or unclear conditions, the AMA flattens and becomes less reactive. This helps reduce attention to short-term price spikes that don’t reflect real direction.
Adaptive Moving Average Trading Strategies
The strategies below show how AMA can be used with other indicators to better understand price movement:
- Combining AMA with RSI & MACD
The Relative Strength Index (RSI) measures how fast and how far prices have moved in a direction, while MACD shows the difference between two moving averages to spot changes in price direction. When combined with AMA, they help confirm the strength behind a price move. For example, if the price goes above the AMA and RSI is also above 50, it supports the upward movement. If the MACD line also crosses above its signal line, it adds further support. Using these together reduces the chances of reacting to a weak signal.
- Combining AMA with Volume Indicators
The volume indicators show how much trading activity is happening during a price move. When price breaks above the AMA on strong or rising volume, it suggests more people are backing the move. On the other hand, if volume is low when price crosses the AMA, the signal may lack strength. This combination helps separate strong price moves from weaker ones.
Pros and Cons of the Adaptive Moving Average
The primary advantages and disadvantages of the adaptive moving average have been discussed below:
Pros:
- It filters out random price jumps better than fixed moving averages, making the line smoother in sideways markets.
- It adjusts quickly when prices move clearly in one direction, allowing closer tracking of the movement.
- It combines information about both price changes and how much the price is moving overall.
- It slows down during quiet markets, helping reduce unnecessary signals when prices aren’t going anywhere.
Cons:
- Like all moving averages, it reacts after the price has already moved, so it doesn’t provide early signals.
- The formula is more complicated than other averages, so it’s harder to calculate manually.
- In sudden reversals, the AMA can still lag and take time to change direction.
- During very calm periods, the AMA can stick close to the price and offer fewer clear signals.
Common Mistakes When Using AMA
Some of the most common mistakes made while using AMA are as follows:
- Using the AMA alone without checking other indicators like volume or price strength tools.
- Keeping the same settings for every chart, even when price behavior varies across assets and timeframes.
- Trusting crossovers when the AMA is flat, which may happen in low-activity markets.
- Reading a flat AMA as a green light to trade ranges, when it might simply mean lack of movement.
- Looking only at the AMA’s direction without checking how far the price is from it, which can also show if prices may slow down or speed up.
Conclusion
The adaptive moving average stands out by adjusting its pace to match changing market conditions, fast when prices move cleanly, slower when they don’t. Unlike fixed indicators, it filters noise without losing touch with price. Trading daily or occasionally, understanding AMA adds clarity when fixed tools fall short.
FAQs
The adaptive moving average (AMA) was invented by Perry J. Kaufman, an American quantitative financial theorist. He developed this indicator to account for both trend direction and market volatility, making the moving average more responsive to changing price conditions.
Yes, the adaptive moving average can be used alongside other technical indicators. Common combinations include pairing AMA with momentum indicators like RSI or volume tools to confirm trend strength, filter reversals, or validate signals for buying or selling.
AMA adjusts to changing market conditions by becoming more responsive during trends and less sensitive during flat periods. This helps reduce false signals, making it generally more adaptive than EMA, which uses a fixed formula.
AMA can be used on any timeframe. However, higher timeframes such as 4-hour or daily charts often provide more reliable signals, while lower timeframes can result in more frequent but less trustworthy signals because of increased market noise.
Yes, AMA can be used for intraday trading. Its ability to adjust to price movement helps track trends. However, very short timeframes may result in more false moves, so it’s often used with additional tools.