Chart patterns in technical analysis function as a visual roadmap for investors. They unfold the collective behaviour of market participants and can detect probable price swings before they happen. The Bearish Cup and Handle pattern is one such lesser-known but potentially reversal setup. Compared to its bullish counterpart, detecting an uptrend’s continuation, the bearish version typically specifies the beginning of a downtrend after a consolidation period.
If properly detected, this pattern can help investors calculate temporary positions with defined risk and strong, powerful reward. In this guide, we’ll discover more about the Bearish Cup and Handle pattern, including its formation, trading pattern, and common mistakes to avoid.
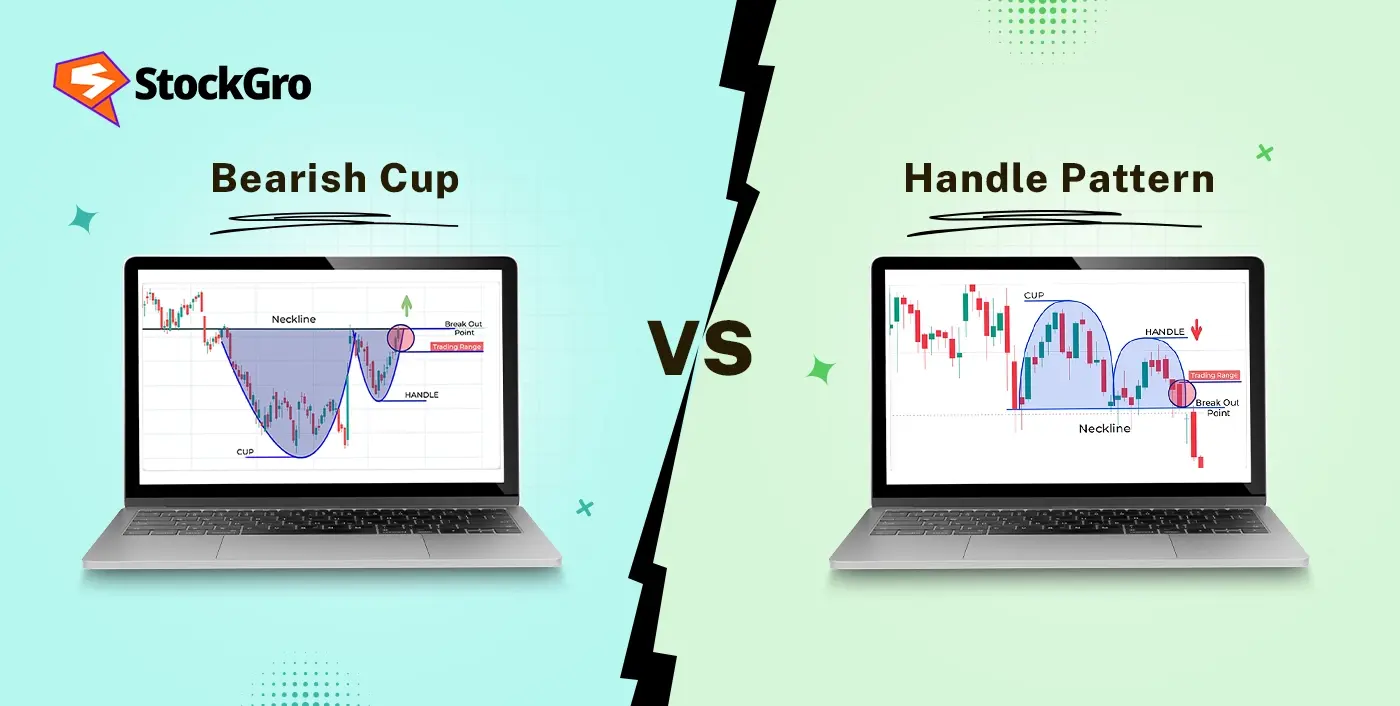
What is a Bearish Cup and Handle Pattern?
The Bearish Cup and Handle pattern is a reversal chart pattern that typically occurs at the end of an uptrend or during a prolonged downtrend.
The name explains its distinctive shape, a rounded top signifying a cup, succeeded by a lesser consolidation zone that marginally slopes upward or sideways, forming the handle. Bearish and bullish cup and handle pattern are types of cup and handle pattern. Directional bias is the main dissimilarity here from the bullish cup and handle, where in the Bearish Cup and Handle pattern:
- The “cup” signifies a gradual price rounding from high to low, indicating weakening buying pressure.
- The “handle” indicates a short upward or sideways move, as a pause before sellers regain control.
- A breakdown beneath the handle’s support level indicates the trigger for further probable downside.
The Bearish Cup and Handle pattern is most consistent when verified by other indicators, such as rising volume at the breakdown or lessening volume during the handle formation.
How the Bearish Cup and Handle Forms
Understanding the formation of this candlestick chart pattern helps investors with early detection.
- Rounded Top (The Cup)
The pattern initiates following a rally, where the price peaks and then declines eventually. Rather than forming sharp drops, the movement forms a smooth, rounded arc, indicating a losing movement to buyers, while sellers gradually gain ground.
2. The Handle
Once the cup formation is done, the price makes a short upward retracement or sideways movement to form a “handle”. Here, the market is taking a breather, and weaker hands are trying to push the price up, whereas the broader sentiment remains bearish.
3. Breakdown
The most vital phase. Once the price breaks beneath the handle’s support, it often activates a new selling wave. Investors consider this a confirmation of the ending of the preceding uptrend and the acceleration of a downtrend.
Tip: For stronger confirmation, find increased volume on the breakdown.
Bearish Cup and Handle Vs Bullish Cup and Handle
While the shapes are alike for the bearish cup and bullish cup and handle pattern, the context and direction are completely dissimilar.
| Feature | Bearish Cup & Handle | Bullish Cup & Handle |
| Trend Context | Commonly happens after a long-term uptrend or within an existing downtrend, indicating the trend’s probable reversal to the downside. It signals that bullish movement is weakening and sellers are taking control. | Forms as an endless pattern during an ongoing uptrend, indicating that buyers are pausing before increasing the price again, keeping the entire bullish movement intact. |
| Cup Shape | A round top showing slow decline from high to low support level, reflecting distribution where selling pressure gradually overtakes buyer interest. | A rounded bottom showing gradual rise from a low point to a higher resistance level, reflecting accumulation where buyers gradually overpower sellers before a bullish movement. |
| Handle Direction | Moves sideways or slopes slightly upwards, which indicates the final buyer attempt before the price breaks down beneath support. | Moves sideways or slopes slightly downwards, indicating a healthy consolidation before the price breaks out beyond resistance. |
| Breakout or Breakdown | At the base of the cup, price breaks down beneath the established support level, ensuring bearish sentiment, which often leads to a sharper decline. | At the rim of the cup, price breaks down beyond the established resistance level, ensuring bullish strength, which often leads to further price appreciation. |
| Trade Bias | Traders usually seek short-selling opportunities, targeting profit from the probable downward move after a breakdown. | Traders usually look for long-buying scopes, targeting to ride the upward movement after a breakout. |
To summarise, bullish indicates continuation upward, whereas bearish is a reversal downward.
How to Trade a Bearish Cup and Handle
Investing in the Bearish Cup and Handle pattern is all about perseverance and validation.
Step 1: Pattern Detection
Verify if the cup has a smooth, rounded top with a moderately short handle (preferably less than one-third of the cup). The handle should move sideways or slope up a bit.
Step 2: Verifying with Indicators
Volume: Lesser while the handle is forming and higher while it collapses.
RSI: Should often be declining, often below 50 before the breakdown.
Step 3: Entry
Put a short entry order just beneath the handle’s support, ensuring you only enter during a genuine breakdown.
Step 4: Stop-loss
Place the stop-loss slightly above the handle’s top to limit losses in case of a misleading breakdown.
Step 5: Targeting Profit
Measuring the cup’s depth and projecting it downward from the breakdown point is a typical strategy to apply.
For instance, if the cup depth is $20, aim for at least $20 beneath the breakdown level.
Best Timeframes & Markets to Use It
The Bearish Cup and Handle pattern is functional across a diverse market, including commodities, stocks, forex, and crypto. But the consistency fluctuates with the timeframe.
- Daily & Weekly Charts: Offer the strongest signals and refine intraday noise and misleading patterns.
- 4-Hour Charts: Best for swing traders seeking more frequent setups.
- 1-Hour or Lower: Intraday traders can use it, but false breakouts are very common.
The Bearish Cup and Handle pattern tends to function more efficiently in markets with strong liquidity and clear trends like large-cap stocks, major currency pairs, and actively traded commodities like crude oil or gold.
Common Mistakes When Trading This Pattern
Investors can fall behind even with a clear setup. Here are the common mistakes:
1. Entering too soon
During the handle formation, many investors anticipate the breakdown and a short, which is risky because the handle can reverse or extend.
2. Overlooking Volume
A breakdown without an accompanying rise in volume can be misleading.
3. Using a Stop Too Tight
If you put a stop-loss too tight, normal market fluctuations might trigger it before the actual movement.
4. Ignoring Market Context
With a strongly bullish broader market pattern, bearish patterns may break down more often.
5. Not Considering Risk Management
Always size positions so that one losing trade doesn’t damage your entire account.
Conclusion
The Bearish Cup and Handle pattern is a potentially commanding and visually different reversal pattern signalling a movement from bullish to bearish sentiment, giving investors a scope to profit from a downward move when timed well.
With this setup, success demands patience by using indicators and volume for boosting confidence, waiting for a confirmed breakdown, and using disciplined risk management. Like other patterns, it’s not perfect but can be a reliable part of your trading journey in the right market conditions.
FAQs
Based on development, the cup and handle pattern can either be bullish or bearish, where bullish is the standard version, forming after an uptrend and indicating continuation. A bearish cup and handle is the inverse, appearing after a rise or within a downtrend, indicating a possible reversal. Its cup is rounded, with a minor upward or sideways handle before prices drop. Traders apply it to predict short opportunities when confirmed by volume, movement indicators, or key support collapses.
The bearish cup and handle pattern functions in different timeframes, but you’ll likely get more consistent signals in the higher ones, like 4-hour, daily, or weekly charts, due to reduced market noise. For intraday trades, shorter timeframes, like 15-minute or 1-hour charts, can be effective but are more inclined to misleading breakouts. Swing traders often prefer the daily timeframe to catch bigger swings, while position traders go for weekly charts. The idea is to pair the timeframe analysis with volume and momentum confirmation before entering a trade.
Yes, just like every other chart pattern, the cup and handle pattern is also not foolproof. Failure often happens due to false breakouts, premature entries before the handle completes, or unexpected market news shifting sentiment. In a bearish cup and handle pattern, prices may appear to break support but bounce back faster, deceiving short sellers. Low trading volume during the breakdown can also weaken the pattern’s consistency. To play it safe, applying stop-loss orders, and authorising with momentum indicators like RSI, avoiding trades during major news events can play a significant role.
To validate the breakout of a bearish cup and handle pattern, find a significant price move below the handle’s support level with above-average volume. This signals strong selling pressure. Many investors also apply momentum indicators like RSI breaking below 50 or MACD crossing bearishly to double-check the signal. Checking different time frames helps ensure the breakout is not just intraday noise. Furthermore, waiting for the breakdown candle to close beneath support instead of reacting mid-move can increase the consistency of the trade setup and lessen false breakout risks.