Reversal patterns often show up before technical indicators can signal a change in momentum, and the Bearish Harami is one such early clue to rely on. A similar setup occurred in Divi’s Laboratories in July 2023, where a Bearish Harami formation appeared just before the stock saw a short-term decline. Understanding this early signal can give traders an advantage in anticipating potential reversals and making better-timed decisions.
To use this pattern confidently, it helps to know how it appears on the chart and the kind of price behaviour it reflects. In this guide, we’ll explore the Bearish Harami—how to identify it, the indicators that strengthen it, and the ways you can use it in your trading approach.
What is the Bearish Harami Pattern?
It is a pattern formed with two-candlesticks and usually appears near the peak of an uptrend. This pattern signals that the buyers are getting weaker, and there is a possibility of trend reversal. Traders use it as an early warning sign to stay ahead of the market.
This pattern contains:
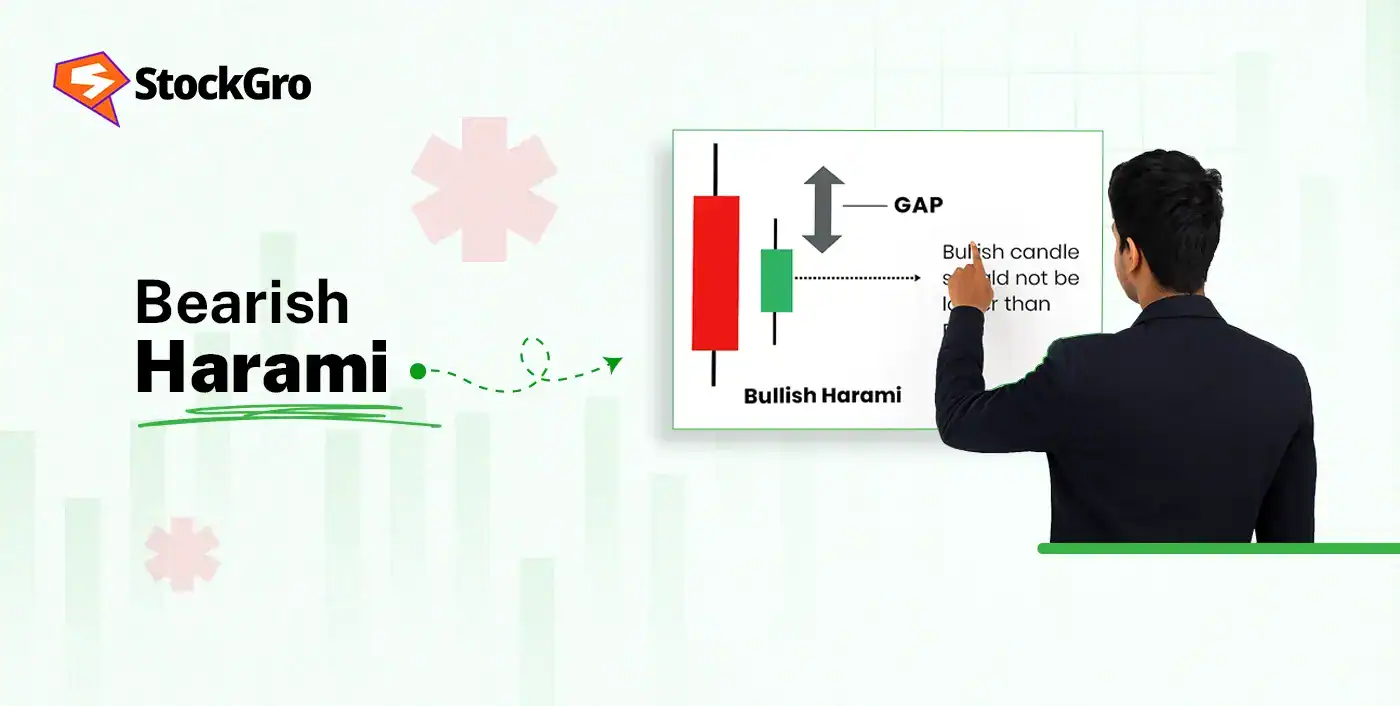
- Candle 1: A big bullish candle
- Candle 2: A smaller bearish candle contained within the first candle’s body
Below is a chart showing a Bearish Harami formation in the Colgate Palmolive stock on 28-29 July 2023.

The change in candle size indicates the reduction in buyer participation, and the second candle confirms the slowdown in their strength. After the pattern appeared, the stock declined in the following trading sessions.
How to identify a Bearish Harami
Once you understand the features of the Bearish Harami pattern, identifying it is quite simple. Here’s what you should look for:
The prior trend must be bullish
The pattern is only useful when it appears after a clear uptrend, as it represents a shift in momentum from buyers to sellers. The trend usually has
- Higher highs: The prices breaking previous highs
- Higher lows: The dips are getting bought at higher levels
- Strong bullish candles: Indicating aggressive buyers
For example, if a stock rises from ₹400 to ₹450 with clear higher highs and higher lows, a Bearish Harami forming at ₹450 is more reliable as it signals buyers are losing strength after an uptrend.
Candle 1
The first candle is bullish and of large size, reflecting the dominance of buyers. It forms the outer body under which the second candle will fit.
Candle 2
The second candle must be
- A bearish candle
- Smaller compared to the first candle
If Candle 2 rises over the high of Candle 1, the pattern becomes invalid, meaning the buying side still has more power.
Check for hesitation
The second candle shows hesitation at the end of the buyers. When the second candle is smaller, it gives a stronger indication of the momentum shift.
Location
The Bearish Harami has more strength when it forms:
- Near or at resistance zones
- After an extended rally
Structure & appearance of a Bearish Harami
A perfect Bearish Harami has the following:
- A large candle bullish in nature
- A small bearish candle, that fits inside the first candle
Time-frames
The reliability of the Bearish Harami pattern varies across timeframes in the following manner:
Intraday: The patterns are moderately reliable since they contain more fluctuations and volatility. They can be used for short-term reversals and quick trades.
Daily: They are highly reliable for spotting Bearish Harami patterns because they clear out the intraday fluctuations and provide clear signals for swing and positional trades.
Weekly: The patterns give the strongest signals, as they reflect long-term trend reversals supported by confirmation signals and market sentiment.
Confirmation signals
A Bearish Harami gains strength when supported by:
Volume: The trading volume helps in confirmation of the pattern as:
- When Candle 1 has high volume, it means the buyers are in control and the trend is upwards.
- Low volume in Candle 2 shows the buyers are losing confidence, and the momentum might be shifting.
- If Candle 2 forms with high selling volume, it gives strong confirmation of the trend reversal.
Support: It is the price level where the movement of a stock’s price is expected to stop. The support adds reliability when the pattern forms:
- Near historical support levels, from where prices have reversed earlier.
- Close to the top of a trendline, where rallies slow down.
RSI: The Relative Strength Index (RSI) is used to understand the direction and speed of change in a stock’s price. An RSI score of over 70 is ideal for Bearish Harami as it signals the stock is currently being overbought.
MACD: The Moving Average Convergence/Divergence (MACD) is helpful to analyse the relationship between two moving averages of a stock price. A bearish crossover in the MACD adds credibility to the trend reversal.
Using volume, RSI, and MACD with Bearish Harami
When the Bearish Harami is used with technical indicators, it has significantly improved accuracy. These indicators help in the manner given below:
Volume
- When Candle 1 forms with high volume and Candle 2 shows shrinking volume, it signals a clear loss of momentum in the uptrend.
- If strong selling volume appears immediately after the pattern, it increases confidence that a reversal is beginning.
RSI
- If a stock rallies from ₹820 to ₹850 with an RSI score of 78, it indicates that the uptrend is at its peak, and it might be coming to an end.
- When the price continues rising, say from ₹850 to ₹860, but the RSI falls from 78 to 65, it clearly shows that buyers are losing strength, increasing the possibility of an upcoming reversal.
MACD
- A bearish crossover in the MACD after the formation of the Bearish Harami makes the signal more accurate.
- When the MACD chart turns red, it shows that momentum is declining and a higher possibility of a reversal.
Bearish Harami vs other patterns
If we compare the Bearish Harami with other similar patterns, we come across the following differences:
Bearish Harami vs Bearish Engulfing
| Parameter | Bearish Harami | Bearish Engulfing |
| Pattern structure | A small bearish candle that fits inside a large bullish candle. | A bearish candle so large it fully eats up the previous candle. |
| Second candle | Small candle, indicating the reduction in power of the buyers | Large, reflecting sellers active participation |
| Signal strength | Moderate, needs to be confirmed with other indicators | Strong signal, can be used alone |
| Market | Buyers losing momentum. | Sellers taking full control. |
| Entry approach | Enter after breakdown is confirmed | Enter after the engulfing candle closes. |
Harami Cross variant
The Harami cross is a powerful variation of the Bearish Harami pattern that occurs when the second candle is a Doji, meaning the opening and closing prices of a stock are identical. In a Harami cross, the market decision is at its peak, and a momentum shift is about to begin.
How to trade the Bearish Harami pattern
If you trade using this pattern, these are the important rules that you have to follow:
Entry rules
Use any of these techniques depending on your risk preference:
Enter After Breakdown Below Candle 2’s Low
Wait for the price to fall below Candle 2’s low and then enter a short position. It confirms that the sellers are gaining power and the pattern is reliable.
Enter after a confirmation candle
Take a short position when the third candle turns bearish. Doing this helps in avoiding any false signals.
Entry near resistance
You can enter the trade even if the Harami is formed near the resistance level. Use tighter stop losses, which help in capital protection.
Stop-loss & target setting
For the capital protection and minimisation of risk, you can place the stop-loss at:
Above the High of Candle 1
Placing it just above the high of the first candle is most reliable because it invalidates the pattern if the price rises above the strong bullish candle.
Near Resistance Zone
If the pattern is formed near the resistance levels, you can place the stop-loss above it, which provides extra protection and reduces the risk.
When you trade with this pattern, set the following targets:
Nearest Support Level: It is the safest target as the price usually pauses or goes back to significant support levels.
Previous Swing Low: The prices often swing near previous lows during a reversal, making them a practical and strong secondary target.
Risk management & trade management
Risk management ensures the safety of capital and prevention of any losses. To minimise the risk while trading, you can use the methods listed below:
Limit the position size
Keeping the position per trade between 1–2% of your capital ensures that a single loss does not wipe off a significant portion of your account.
Scale out at resistance zones
Booking partial profits at major resistance levels helps reduce risk while keeping the remaining position open to benefit from further price movements.
Avoid early entries
Instead of immediately entering after the formation of the second candle, you should wait. Use technical indicators to confirm the signal before you start to trade.
User trailing stop-loss
With the help of a trailing stop-loss, you can lock in profits when the stock has favourable movement while leaving space to benefit from price fluctuations during the reversal.
Avoid volatile markets
Sideways and intraday markets do not clearly capture the trend and may produce false signals. It is better to avoid trading when the market is uncertain.
Mistakes & limitations of the Bearish Harami pattern
While this pattern is very helpful in trading, it’s important to understand its limitations and common mistakes often made by people when using it:
Common Mistakes
Entering without confirmation: Entering a trade as soon as the Harami forms is a risky manoeuvre, as the reversal is not confirmed and the setup can fail.
Trading in a sideways market: The sideways market is range-bound, making the chances of reversal very low. Trading in such conditions is not effective.
Ignoring the support levels: Entering a trade without checking the support levels can lead to premature entries, as the price may bounce up from those levels or slow down near the resistance.
Using excessively tight stop-losses: Placing very tight stop-losses can trigger early exits due to minor fluctuations, causing you to lose out on more profits.
Position Sizing: A pattern appearing with low volume carries lower conviction, so taking large positions greatly increases the risk.
Limitations
Works best only after strong uptrends: Without a clear prior uptrend, the Bullish Harami pattern gives weak reversal signals.
Unreliability in volatile markets: Using the pattern in uncertain markets carries high risk and may produce false signals.
Needs confirmation: The pattern alone is not very effective. It has to be combined with other indicators such as volume, RSI and MACD to draw out the best results.
Conclusion
The Bearish Harami pattern is a very powerful tool that can be used for the identification of a weakening bullish momentum and the possibility of a trend reversal. When used with confirmation indicators such as volume, RSI, and MACD, it becomes more reliable.
While using this pattern is proven to be effective, risk management, position sizing and patience for confirmation are required to properly pull it off. Understanding its strengths, limitations, and ideal setups enables us to trade with higher confidence.
FAQ‘s
A Bearish Harami is a two-candle reversal pattern where a small candle forms entirely inside a large bullish candle, signalling weakening buying momentum.
You trade it by entering short when the price breaks below the second candle’s low or after a bearish confirmation candle forms.
A Bearish Harami shows a small candle inside a big bullish candle, while a Bearish Engulfing shows a large bearish candle completely engulfing the previous candle.
It is moderately reliable and works best with confirmation from volume, resistance, or indicators like RSI and MACD.
Place the stop-loss above Candle 1’s high and set profit targets at the nearest support level or the previous low swings.
It can be used on both intraday and daily charts, though daily charts give more reliable signals.
Common mistakes include entering without confirmation, ignoring support/resistance, and using overly tight stop-loss levels.