Markets speak through structure. While some candles hesitate, the Bearish Marubozu is one such formation that makes a clear, decisive statement. It reflects strong selling pressure and clear momentum. In this blog, we will understand its formation, signals, and application in trading.
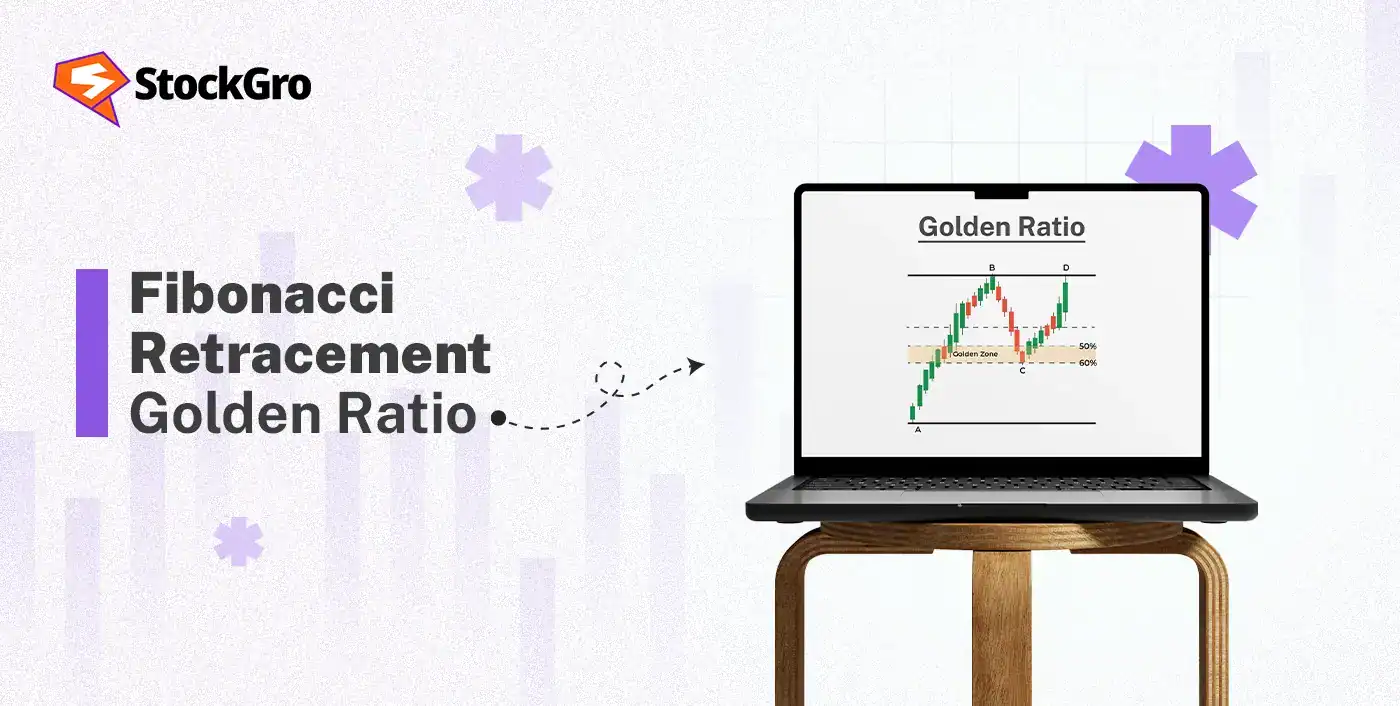
What is a Bearish Marubozu candlestick?
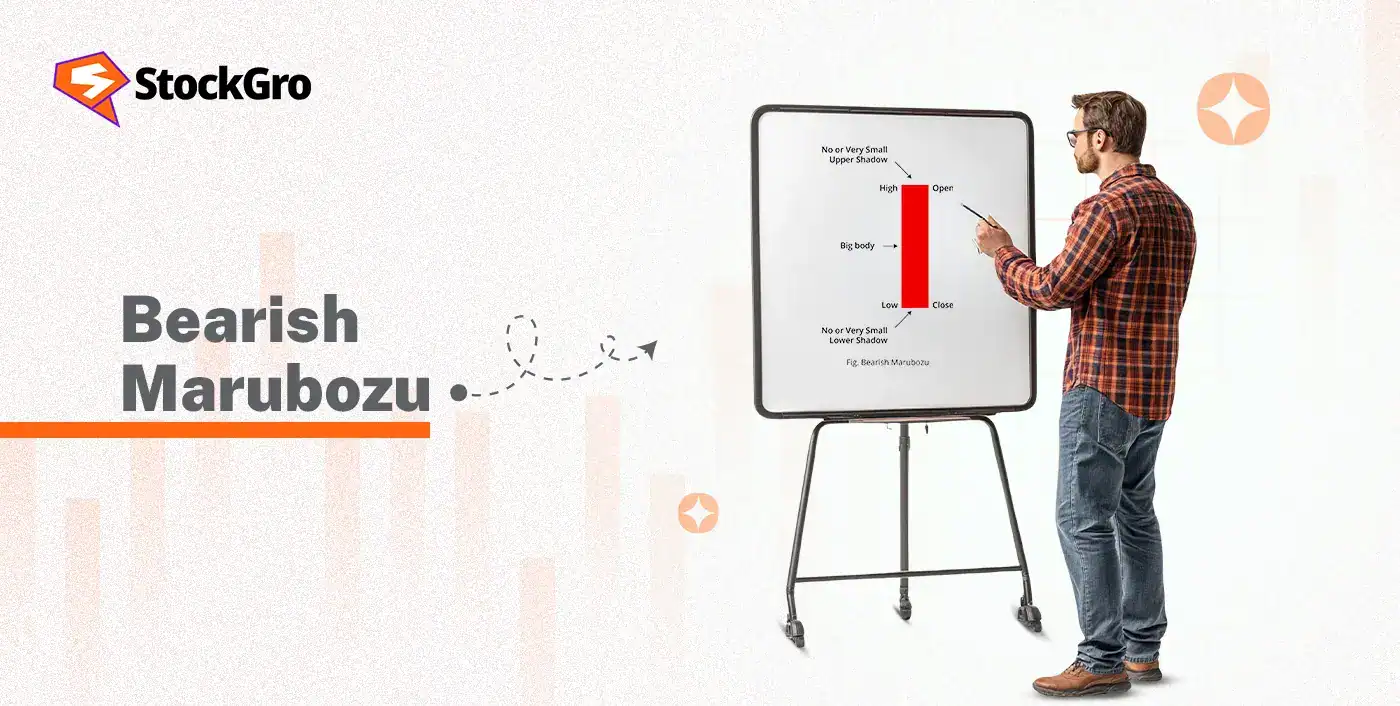
The Bearish Marubozu is a single-candle chart pattern where the opening price is equal to the session high and the price closes equal to the low. It shows that the sellers were in control, pushing the prices lower from where they began at the start of the trading day.
In Japanese, the word “marubozu” translates to “bald head” or “shaved head”. which refers to the formation of the bearish marubozu, which has no wicks.
Bearish Marubozu vs a “long red candle”
Not every long red candlestick pattern can be considered a Bearish Marubozu. The wicks make the difference.
A regular long red candle may still have upper or lower shadows, meaning buyers attempted a pushback during the session. However, a Bearish Marubozu has no upper or lower wicks (shadows).
If there are tiny shadows, it may be called a “near-Marubozu.” But if the wicks are clearly visible, it’s simply a long red candle, not a pure Marubozu.
The wicks are important because their absence shows that there were no meaningful recovery attempts, and the bearish pressure continued to grow.
Where does a Bearish Marubozu work best?
Like any pattern, context is everything. A Bearish Marubozu is more effective when it appears at technically important locations.
Continuation: appears within a downtrend
In an existing downtrend, the Bearish Marubozu signals continuation. It shows that bearish momentum is still strong and sellers are pressing further.
In trending markets, continuation trade setups tend to work better.
Breakdown: candle closes below a key support level
The support and resistance levels also help in identifying areas where the Bearish Marubozu will perform well.
If the price had been holding above support and then suddenly breaks it with a Marubozu, it suggests a decisive breakdown. It shows that buyers failed to defend the price level, and the sellers will continue their momentum.
Breakdowns supported by structure tend to carry more weight.
Reversal risk: forms after an extended upward move near resistance
Sometimes, a Bearish Marubozu appears after a long rally, near resistance, signalling exhaustion of buyers.
But traders should be cautious. A single candle alone does not confirm a full reversal. It increases the probability, but confirmation is still needed.
How to identify Bearish Marubozu
Recognition is simple once you know what to look for.
Open = High, Close = Low
The Bearish Marubozu gets its structure from the prices opening at high and closing at low. A clean formation has:
- No upper shadow
- No lower shadow
- A long red body
The larger the body relative to recent candles, the stronger the signal.
“Near-marubozu” vs invalid candles
Markets are rarely perfect. Often, you will see very small shadows. A near-Marubozu with tiny wicks is still valid if:
- The body is large.
- The shadows are minimal.
- Momentum is clear.
However, if the candle has noticeable wicks on both sides, it is not a Marubozu; it is simply a long red candle.
Let’s understand the appearance of the Bearish Marubozu with Asian Paint’s price movement.
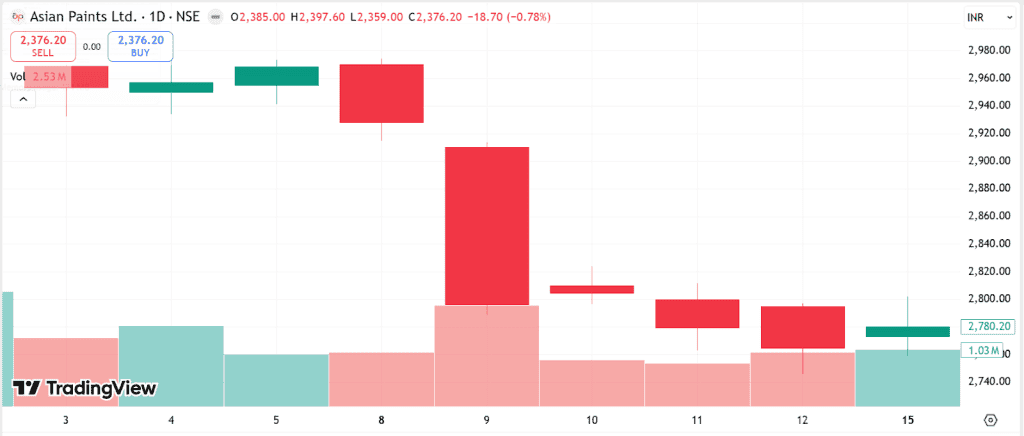
- On December 9, 2025, the price opened around ₹2,910, the session high, and closed near the session’s low at ₹2,795.
- The body is long and red, signifying the bearish sentiment.
- However, the small shadows mean that the candlestick is a near Bearish Marubozu, not a perfect one.
Market psychology of Bearish Marubozu
Understanding psychology makes the pattern more meaningful.
- Aggressive Selling From the Open
The session starts with immediate selling pressure, showing that sellers were prepared and confident. There is no hesitation when the market opens, which signals clear bearish intent and strong momentum. - Buyers Failing to Regain Control
The buyers try to recover but fail to push the price upwards. The answer of an upper wick suggests that demand is weak, and it is hard to absorb the selling pressure. - Pressure on Bullish Traders
Traders holding long positions start to panic as the price falls without recovery. The emotional pressure can result in exits, which further adds to the downside momentum. - Shift in Market Sentiment
A Bearish Marubozu reflects dominance by the sellers. It signals that market sentiment has tilted strongly toward bearish control. - Expectation of Continued Weakness
As the candle closes at its low point, possible follow-through is expected in the next trading session. This fuels bearish sentiment and continued selling pressure.
How to Confirm Bearish Marubozu
These confirmation steps help in evaluating the strength before acting on the Bearish Marubozu formation.
Volume confirmation: when it strengthens the signal
Checking the volume helps in understanding the level of market participation. If the move is supported by genuine market interest, it is more likely to become sustainable.
If the Bearish Marubozu is backed by high volumes, it means sellers are becoming more decisive. It indicates the signal is reliable and can be used to set up trades.
Multi-timeframe check: higher timeframe trend + level
Using a multi-timeframe analysis aids in identifying the overall direction. Reading the charts on different settings to confirm the Bearish Marubozu.
If the broader trend is downward and the Marubozu forms near after a support break, the selling momentum becomes more reliable.
Confluence tools: MA / RSI
Confluence tools such as the Moving Average (MA) and the Relative Strength Index (RSI) help validate the strength of the formation.
The MA smooths out the price data to show the trend direction, while the RSI assesses the speed of price movement and tells if the conditions are overbought or oversold.
When the Bearish Marubozu formed with the price falling below the moving average and the RSI dropping from overbought levels, it means the signal is supported by the broader market momentum.
How to trade a Bearish Marubozu
A Bearish Marubozu becomes tradable only when combined with structure and confirmation. Below is a step-by-step framework that can be used for trading.
Entry options:
Entries should be considered only after the candle closes. You can enter immediately if the candle breaks a strong support level with volume confirmation.
You can also take a more conservative approach by waiting for a small pullback toward the midpoint, as it gives a better risk-reward ratio.
Example: Suppose a stock is trading near the support at ₹500. A Bearish Marubozu forms at ₹480 after breaking the support. Wait for the confirmation from volume and enter a short position at ₹478 once the price continues lower.
Stop-loss placement:
The stop-loss should be placed above the high of the Marubozu candle or just above nearby resistance. It helps in protecting the capital if the breakout fails or if the buyers regain control and push the prices higher.
Example: The stock in which you took a position had a high of ₹502. Place the stop-loss at ₹505. With an entry at ₹478 and a stop at ₹505, the total risk becomes ₹27 per share.
Targets:
Targets should be based on the next support zone or a fixed risk-reward ratio. It is common to use a 1:2 ratio for enjoying profits while maintaining discipline.
Example: With a risk of ₹27, a target of 1:2 would be ₹424. If the next support lies near ₹430, you can book profits around that level or hold the position if momentum is still continuing downward.
Bearish Vs Bullish Marubozu
The following table shows how the Bearish Marubozu differs from the Bullish Marubozu:
| Feature | Bearish Marubozu | Bullish Marubozu |
| Direction | Strong downward price momentum with sustained selling pressure | Strong upward price momentum with sustained buying pressure |
| Candle | Red or black body structure with no visible shadows | Green or white body structure with no upper or lower wicks |
| Opening Price | Opens at session’s high level | Exactly at session’s low level |
| Closing Price | At session low level reflecting persistent bearish control | Closes at session high level showing bullish control |
| Market Control | Sellers dominate without meaningful buyer resistance | Buyers dominate and sellers fail to make recoveries |
| Trading Bias | Indicates short-selling trading opportunities | Signals long positions in uptrend continuation |
| Psychology | Fear and strong selling conviction | Confidence and aggressive buying |
Conclusion
The Bearish Marubozu is a powerful candlestick that reflects sellers dominating the market. Its clean structure makes it visually strong and easier to interpret its signals.
However, no single candle guarantees success. Combining it with other indicators and risk management improves reliability and transforms the pattern into a structured trading setup.
FAQ’s
A bearish marubozu indicates strong and sustained selling pressure. The absence of wicks shows buyers failed to push prices higher, reflecting dominance by sellers.
It can act as either, depending on context. In an existing downtrend, it often signals continuation, while near resistance after an extended rally, it may hint at a potential reversal.
The pattern becomes more reliable when supported by higher volume, alignment with the overall trend, and confirmation from key support or resistance levels. Alone, it should not be traded blindly.
Wait for confirmation, then plan your entries near the close or on a pullback. Place the stop-loss above the high, and target the next support level.
A marubozu shows strong directional conviction with a long body and no wicks, while a doji represents indecision, with a very small body and noticeable upper or lower shadows.
“Marubozu black” refers to the traditional charting term for a bearish marubozu candle, typically shown as a solid black or red body with no upper or lower wicks.
Yes, it can work in intraday trading when aligned with the higher timeframe trend. However, confirmation through volume and other technical indicators remains important to reduce false signals.