Sometimes a chart makes higher highs, yet the move feels weaker with each push. This mismatch is often what traders look for when using bearish RSI divergence. SEBI’s recent studies on individual traders in equity derivatives reveal that over 90% of individual trade participants incur losses, highlighting the need for tools like RSI oscillators to detect early weakness during fast up-moves. This guide explains how this divergence forms, the settings that highlight it clearly, and a straightforward example showing how traders use it in real market conditions.
What is Bearish Divergence in RSI?
The bearish RSI divergence is a technical pattern that occurs when the price of an asset forms higher highs while the Relative Strength Index (RSI) indicator simultaneously forms lower highs. This discrepancy suggests that although the price is rising, the momentum behind the upward move is weakening. Traders utilise this signal to anticipate potential trend reversals or corrections, as the bearish RSI divergence indicates that buying pressure is fading and sellers may soon take control.
How RSI Indicator Measures Momentum
The RSI indicator evaluates the speed and change of price movements to identify market momentum through specific mechanics, as follows:
- Oscillator scale: The indicator operates on a scale from 0 to 100, providing a standardised method to assess the internal strength of a price trend relative to its recent history.
- Price comparison: It calculates the ratio of average gains to average losses over a specified period, typically 14 days, effectively measuring how fast prices are changing to determine if the asset is over-extended.
- Overbought and oversold levels: Readings above the 70 level generally signal overbought conditions where momentum may slow, while readings below 30 indicate oversold conditions, helping traders quantify extreme momentum shifts before price action reacts.
Why Bearish Divergence Signals Trend Reversal
This pattern serves as a critical warning sign for traders because it highlights a fundamental disconnect between price action and market sentiment, such as:
- Momentum exhaustion: When price pushes to a new peak but the RSI fails to follow suit, it reveals that the enthusiasm of buyers is depleting, and the upward trend is being sustained by fewer participants.
- Shift in control: The divergence visually represents the transition from a market dominated by aggressive buying to one where selling pressure is quietly accumulating, often preceding a significant price drop.
- Early warning system: Unlike lagging indicators that react after a trend changes, bearish RSI divergence acts as a leading indicator, providing an early alert that the current uptrend is losing its structural integrity and a reversal is highly probable.
Types of Bearish Divergence
Traders categorise these momentum discrepancies into two distinct patterns based on the specific alignment of price peaks and indicator peaks, which include:
- Regular Bearish Divergence
This is the most common form of divergence used to spot potential trend reversals at the end of an uptrend. It is identified when the price action makes a higher high, but the RSI indicator creates a lower high. This signal suggests that the prevailing bullish trend is losing momentum and a downward reversal is likely. Traders look for this pattern in overbought territory (above 70) to increase reliability, as it indicates the market is stretched and buyers are exhausted.
- Hidden Bearish Divergence
This pattern differs as it typically signals the continuation of an existing downtrend rather than a reversal. It occurs when the price makes a lower high during a retracement in a downtrend, while the RSI makes a higher high. This setup indicates that despite the temporary pullback in price, the underlying momentum is recharging for another move lower. It confirms that the bears are still in control and the downtrend is likely to resume after the brief pause.
How to Identify Bearish Divergence on a Chart
Accurately spotting this pattern requires careful observation of the relationship between price peaks and indicator peaks, as follows:
- Align peaks: Traders must visually align the high points on the price chart with the corresponding high points on the RSI oscillator to ensure they are comparing the same specific timeframe and market event.
- Draw trendlines: A trendline is drawn connecting the recent swing highs on the price chart and a separate trendline connecting the corresponding peaks on the RSI; divergence is present if the price line slopes upwards while the RSI line slopes downwards.
- Check extremes: Identification is most effective when the divergence occurs near or within the overbought zone (above 70), as this context reinforces the signal that the asset’s upward momentum is unsustainable.
- Price action confirmation: The pattern is valid only when the most recent price peak is clearly higher than the previous one, confirming the bearish RSI divergence structure against the declining oscillator.
Step-by-Step Chart Example of Bearish RSI Divergence
To practically apply this concept, traders can analyse the specific setup observed on the Godrej Properties Ltd 15-minute intraday chart from late January to early February, which details the interaction between price action and momentum, as follows:
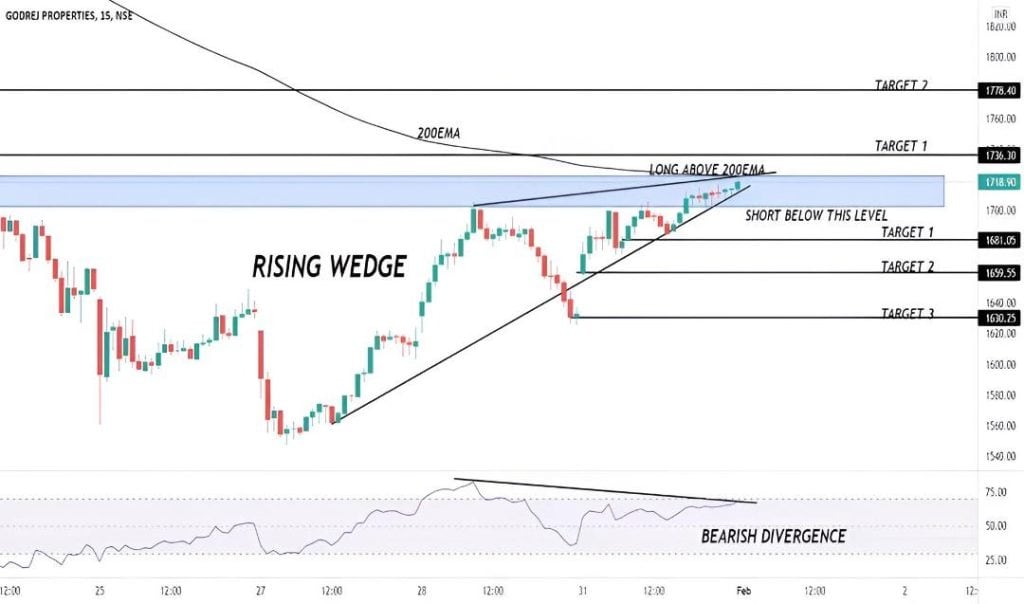
- Pattern formation: The stock is trading within a “Rising Wedge” pattern, characterised by narrowing trendlines that typically indicate weakening buying pressure, further suppressed by the 200 EMA (Exponential Moving Average) acting as overhead resistance.
- Identifying the divergence: A classic bearish RSI divergence appears as the price successfully makes higher highs near ₹1,718, while the RSI indicator below fails to confirm this move, instead creating lower highs to signal momentum exhaustion.
- Entry confirmation: The setup identifies a potential entry point for a short position only upon a decisive breakdown below the wedge’s lower support line, rather than entering at the top solely based on the divergence.
- Defined targets: To manage the trade, specific profit targets are established at ₹1,681, ₹1,659, and ₹1,630, allowing traders to capture profits as the price potentially retreats toward previous structural support levels.
Best RSI Settings for Divergence Trading
While the default parameters are widely used, traders often adjust settings to filter noise or increase sensitivity based on market conditions. The best RSI settings for divergence as follows:
- Standard period: The default 14-period setting is the most universally accepted configuration for divergence trading, offering a balanced view of momentum that smooths out minor fluctuations while remaining responsive to significant trend changes.
- Short-term adjustments: For more aggressive trading or volatile assets, reducing the period to 9 can provide earlier signals, though this increases the risk of false positives by reacting too keenly to minor price spikes.
- Trend adjustments: In strong bull markets, the overbought threshold may be adjusted from 70 to 80, as assets can remain overbought for extended periods; conversely, in bear markets, the resistance level might be lowered to 60 to better capture hidden bearish signals.
- Smoothing: Some traders apply a moving average to the RSI line itself to smooth out jagged peaks, making it easier to identify clear high points for drawing divergence trendlines.
Timeframes for Bearish Divergence
The reliability and frequency of divergence signals vary significantly depending on the chart interval selected for analysis, such as:
- Daily timeframes: The daily chart is considered one of the most reliable timeframes for identifying bearish RSI divergence, as it filters out intraday noise and represents substantial shifts in market sentiment that can lead to multi-day or weekly corrections.
- 4-hour charts: Swing traders often prefer the 4-hour timeframe as it offers a middle ground, providing more frequent opportunities than the daily chart while maintaining a higher degree of accuracy than lower timeframes.
- Intraday (15-Minute): While divergence appears frequently on 15-minute or 5-minute charts, these signals are prone to higher failure rates and often result in minor pullbacks rather than full trend reversals, requiring tighter risk management.
- Weekly context: checking the weekly timeframe for divergence can serve as a powerful macro filter; a divergence here signals a major cyclical top, carrying the most weight for long-term trend analysis.
Trade Strategy Using Bearish RSI Divergence
Executing a trade based on the bearish RSI divergence pattern requires a structured approach to risk and entry timing rather than blindly selling at the first sign of divergence, which include:
- Entry, Stop-Loss & Target Placement
- Entry trigger: Traders should not enter immediately upon spotting the divergence but wait for price confirmation, such as a bearish candlestick close (like a shooting star) or a breakdown below the recent support line.
- Stop-loss: A protective stop loss is typically placed just above the recent swing high of the divergence setup; if the price breaks this level, the bearish thesis is invalidated and the trend may continue.
- Profit target: Targets are often set at the next immediate support level or defined using a risk-reward ratio of at least 1:2, ensuring that the potential profit justifies the risk taken on the reversal trade.
Confirmation for Higher Accuracy
To minimise false signals, traders frequently combine divergence with other technical tools to validate the weakening momentum, such as:
- MACD , MA
- Moving averages: A price close below a key Moving Average (like the 50-day MA) serves as a concrete signal that the trend structure is breaking, confirming the weakness suggested by the RSI.
- Volume analysis: Analysing volume is essential; a decline in trading volume during the formation of the higher price peak further validates the lack of institutional interest in higher prices.
- Combine RSI Divergence with MACD
- Dual divergence: When bearish RSI divergence coincides with bearish divergence on the MACD (Moving Average Convergence Divergence) histogram or signal lines, the probability of a successful reversal increases significantly.
- Histogram reversal: A shrinking MACD histogram or a bearish crossover of the MACD lines provides a secondary momentum confirmation, indicating that the selling pressure observed on the RSI is broad-based across different momentum calculations.
Conclusion
Bearish RSI divergence serves as a valuable alert for potential market shifts, yet it is rarely effective as a standalone trigger. A successful application relies on patience and strict risk management. Traders often achieve better consistency by waiting for clear price confirmation and integrating this pattern into a broader technical framework rather than acting on the signal in isolation.
FAQ‘s
Bearish RSI divergence occurs when price forms higher highs while RSI makes lower highs, typically in overbought conditions (RSI >70). This shows weakening buying momentum despite rising prices, signalling potential trend reversal as sellers gain control.
After a bearish divergence, the price often reverses downward as buying exhaustion sets in. The uptrend loses steam, leading to pullbacks or full reversals. Traders watch for breakdown below support or bearish candles to confirm the move.
Bullish RSI divergence happens when price makes lower lows but RSI forms higher lows, usually in oversold territory (RSI <30). It indicates fading selling pressure and potential upward reversal as buyers regain momentum.
High RSI (above 70) indicates overbought conditions, which is bearish as it suggests the asset may be due for a pullback or reversal. However, in strong uptrends, high RSI can persist without immediate downside.
Confirm bearish divergence with price breakdown below recent support, bearish candlestick patterns (shooting star, evening star), rising volume on downside, or resistance tests. Wait for RSI failure to swing prior lows below for stronger validation.