Ever found yourself staring at a flat chart, thinking, “Nothing’s happening here,” and then, out of nowhere, the price just explodes up or crashes down? That’s often a Bollinger Band breakout calling for your attention. Let’s make sense of this pattern, see what really matters, and share the kind of smart, practical steps that actually work for Indian traders.
What is a Bollinger Band Breakout?
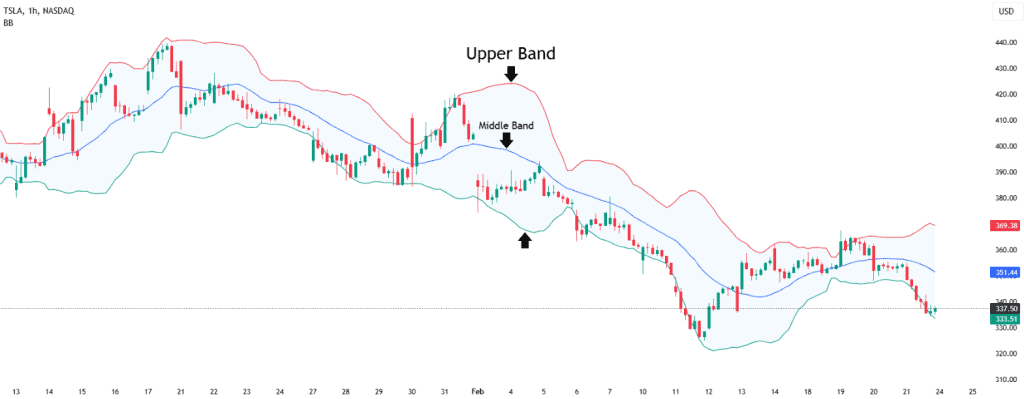
A Bollinger Band breakout occurs when price moves outside the upper or lower band, signaling a potential trend start or strong price momentum. Bollinger Bands consist of three lines: a SMA of the closing prices forms the middle band, and two bands, one above and one below, spaced two standard deviations apart, make up the other two bands.
This simple but useful configuration is a popular technical analysis tool designed to adapt to changing market conditions.
How Does a Bollinger Band Breakout Work?
Bollinger Bands are made of three lines:
- The 20-day simple moving average (SMA) is in the middle band.
- An upper band is SMA plus two standard deviations.
- A lower band is SMA – 2 standard deviations.
The bands get bigger when the market is unstable and smaller when it is calm. A breakout happens when the price closes beyond the outer bands. When the price closes over the top band, it usually means that a lot of people want to buy. But if the close is below the bottom band, it could mean that there is more pressure to sell.
The principle is simple: if the price moves outside of the bands, it’s not following its normal pattern. This could suggest that something huge is happening.
How to Identify a Bollinger Band Breakout
These are the signs of a real breakout:
- Strong candle closing outside the band (not just a wick)
- High volume on the breakout candle
- For the next few candles, keep going in the same direction.
Breakouts are more crucial when they happen after a time when the market isn’t moving much or is stable. They tend to be less reliable when the market is unstable or reacting to changes that weren’t expected.
Best Bollinger Band Settings for Breakout Trading
The default settings for Bollinger Bands are:
- Period: 20
- Standard deviation: 2
The majority of the time, these are effective. Having said that, there isn’t a silver bullet. To find the best signals, experiment with different timeframes and charts.
Bollinger Band Breakout Trading Strategies
Step 1: Spot Low Volatility Areas
Check out the spots on the chart where the Bollinger Bands are tight and closely aligned. This narrowing suggests that the market is tranquil, and a surprise change in price could happen at any time.
Step 2: Watch for Breakout Hints
As the price starts edging closer to either the upper or lower band, stay alert. These moments often come just before a breakout. Don’t jump in yet, just observe how the price behaves near these key levels.
Step 3: Confirm the Breakout
Plan your trade when the candle closes outside the band, above the upper band for buying, or below the lower band for selling. A strong candle with clear direction is a better signal than just a temporary spike.
Step 4: Place Your Stop-Loss Smartly
If you are buying after a break above the upper band, place your stop-loss near the lower band or below the recent swing low.
Place your stop-loss in the upper band or slightly above recent highs if you are selling after a breach below the lower band.
If the breakout doesn’t work and the price goes the other way, this will protect you.
Step 5: Set a Practical Target
You should try to get at least twice the reward for the danger you’re taking (a 1:2 reward-to-risk ratio). You can also close the trade when you detect signs that the price momentum is slowing down, including small reversal candles, indicators that are moving in various directions, or a decline in volume strength.
Example of a Bollinger Band Breakout Trade
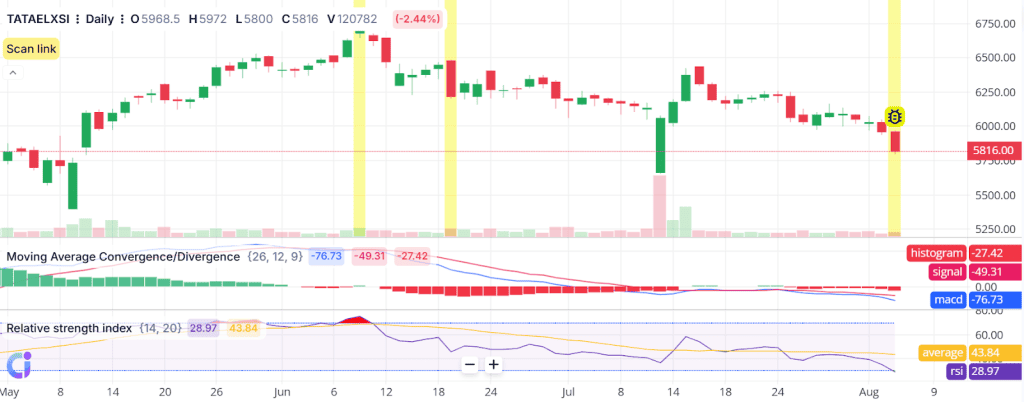
An example of a Bollinger Band breakout is visible on the daily chart of TATAELXSI as July gives way to August. For much of July, price action moved in a tight, sideways range. If Bollinger Bands were overlaid, they would appear increasingly narrow, highlighting a squeeze and signalling reduced market volatility.
At the start of August, the chart displays a decisive red candle breaking below the lower end of this consolidation. The move occurs with a noticeable increase in trading volume, suggesting real participation behind the drop. The RSI also drops further into the oversold area, and the MACD histogram stays deep in negative territory, both of which are signs that bearish strength is likely to stay strong.
A disciplined trader would consider this clear break below the range, combined with volume and momentum, as a breakout entry. To control risk, the stop-loss might be set immediately above the high of the breakout candle or close to the upper Bollinger Band. Possible objectives could be based on the width of the preceding range or a significant support zone.
The price stays weak for a few days after the breakthrough, which confirms the move and rewards those who waited for both price confirmation and supportive indications. This chart underlines the importance of allowing a breakout to develop fully, with confirmation from both volume and momentum tools, before committing to a trade.
Indicators to Confirm Bollinger Band Breakouts
Strong moves are rarely alone; volume is the first thing to check. Rising volume suggests the crowd is backing the move. An RSI above 50, but not too high, offers extra confidence. MACD crossovers, in the breakout direction, are another strong support. ATR can also verify if the market’s truly getting more volatile.
Bollinger Band Breakout vs. Bollinger Band Squeeze
| Feature | Bollinger Band Breakout | Bollinger Band Squeeze |
| Signal | Price moves outside the band | Bands contract, volatility drops |
| What it shows | Volatility arriving, new trend forming | Market is quiet, move may be coming soon |
| Best trade reaction | Enter on breakout, with confirmation | Prepare for breakout, wait for close |
| Risk | False signals if market snaps back | No trade until breakout actually occurs |
Pros and Cons of Trading Bollinger Band Breakouts
Pros:
- Works on many markets and any chart timeframe.
- Shows when the calm is over and a new move is starting.
- Gives straightforward stops and targets.
- Helps catch moves just as momentum turns.
Cons:
- False breakouts happen, especially with weak volume.
- Does not tell you in advance which way to trade; confirmation is key.
- Less effective in strong trending markets where bands stay wide.
Conclusion
A Bollinger Band breakout is a simple but effective way to tell when the market might turn around. If the price goes through the outside bands, it suggests that something unusual is happening, which could lead to a tradeable move.
However, not every breakout leads to a trend. Your chances go up when you combine the breakthrough with volume, chart patterns, and other indicators.
FAQs
A breakout happens when the price closes outside of the Bollinger range’s upper or lower band. It signifies that the price is going outside of its normal range, which normally happens after a time when things aren’t very volatile. Traders watch it for possible strong moves.
First, look for a tight squeeze where the bands are narrow. Then wait for a strong candle to close above or below the bands. Enter with confirmation, place a stop-loss inside the band, and aim for a good reward ratio.
Bollinger Bands work well on any time frame, but the 4-hour and daily charts for stocks and cryptocurrencies are where you usually get the best signals. Day trading can work with shorter timeframes, like 1 hour or 15 minutes, but they are more likely to have false breakouts.
Traders often employ volume, RSI, and MACD. More volume during the breakout makes it stronger. Use RSI to find out how strong a trend is, and MACD to find out which way it is going. These tools work together to help traders find and avoid fake breakouts, which helps them make better decisions.
A squeeze happens when the bands grow closer together. It means the market is at ease and not very volatile. A breakout is the sharp move that often follows. Think of the squeeze as the buildup, and the breakout as the release of pressure or energy.