Price charts rarely tell the full story. A stock may look strong while money quietly flows out, or appear weak even as buyers step in. These hidden shifts often go unnoticed in price alone. Volume brings them into focus, and that is where the Chaikin Money Flow indicator adds value.
By integrating price and volume, CMF helps to determine if a trend is supported by actual buying or selling activity. This guide assists investors in using CMF to identify authentic trends and make better trading decisions.
What is the Chaikin Money Flow (CMF) Indicator?
The Chaikin Money Flow (CMF) indicator is a technical analysis technique that was created in the 1980s by Mark Chaikin. It is used to calculate the flow of volume in a stock over a certain period of time. It takes into account two major factors: where the price closes and the volume with which it closes.
When a stock consistently closes near the top of its daily range on strong volume, buying pressure is likely in control. Conversely, repeated closes near the bottom of the range with expanding volume suggest selling pressure.
CMF helps show whether buying or selling pressure is dominant, with positive values pointing to stronger buying interest and negative values reflecting heavier selling activity.
How to Trade with the CMF
Chaikin Money Flow allows traders to go beyond price action and see if there is real participation driving the price. Rather than just reacting to price, it provides information on who is really in charge, making it a valuable tool for confirmation of trends, better timing, and detecting early changes in momentum.
Trends Confirmation
CMF is often used to check whether a trend has genuine support or is running on weak conviction.
- As long as the CMF is above the zero line, it indicates consistent buying interest and thus helps to confirm the continuation of an upward trend.
- If the CMF drops or remains below zero, it indicates consistent selling pressure and thus helps to confirm a downward trend.
The higher the CMF, whether it is positive or negative, the stronger the trend momentum, and the MACD can be used to determine if the overall trend has enough strength behind it.
Crosses
When CMF crosses the zero line, it highlights moments when buying and selling pressure begins to shift.
- A move above the zero-line points to increasing buying activity and may support a shift in price direction.
- A move below the zero-line signals growing selling pressure and can warn that the balance is turning.
Because brief crosses can be misleading, traders often wait for CMF to hold away from zero or seek confirmation from momentum indicators like RSI before acting.
Divergence
Divergence between price and CMF may indicate weakness that is not apparent on the surface.
- If the price rises but the CMF doesn’t, it is a sign that the buying power is waning.
- If price falls to new lows but CMF holds steady or improves, it is a sign that the selling power is weakening.
In strong trends, price and CMF usually move in sync. When they don’t, it often signals that momentum is starting to change.
How the Chaikin Money Flow is Calculated
To calculate the Chaikin Money Flow (CMF), the following steps and formulas are implemented:
| Step | What is Calculated | Formula |
| Step 1 | Money Flow Multiplier (MFM) | [Close − Low − (High − Close)] / (High − Low) |
| Step 2 | Money Flow Volume (MFV) | MFM × Volume |
| Step 3 | Chaikin Money Flow (CMF) | Sum of MFV for the period / Sum of Volume for the period |
Let’s have a clear understanding of CMF calculation with an example for a 3-day period.
| Day | High | Low | Close | MFM | Volume | MFV |
| Day 1 | 220 | 200 | 215 | 0.50 | 150,000 | 75,000 |
| Day 2 | 225 | 210 | 212 | −0.73 | 90,000 | −6,300 |
| Day 3 | 230 | 215 | 228 | 0.73 | 110,000 | 80,300 |
Day 1
MFM = (215 − 200 − (220 − 215)) / (220 − 200)
MFM = 10 / 20 = 0.50
MFV = 0.50 × 150,000 = 75,000
Day 2
MFM = (212 − 210 − (225 − 212)) / (225 − 210)
MFM = −11 / 15 = −0.73
MFV = −0.73 × 90,000 = −66000
Day 3
MFM = (228 − 215 − (230 − 228)) / (230 − 215)
MFM = 11 / 15 = 0.73
MFV = 0.73 × 110,000 = 80,300
Final CMF Calculation (3-Day Period)
- Sum of MFV = 75,000 − 66,000 + 80,300 = 89,300
- Sum of Volume = 150,000 + 90,000 + 110,000 = 350,000
CMF = 89,300 / 350,000 = 0.26 (approximately)
Typical settings (period, look-back)
The typical look-back period for the Chaikin Money Flow indicator is approximately 20 or 21 days. The CMF reading usually ranges between +1 and -1.
A positive reading of the CMF indicator indicates strong buying pressure, whereas a negative reading indicates strong selling pressure in the stock.
CMF vs Other Indicators
Chaikin Money Flow shows how price and volume move together, but it is only one way to read money flow. Comparing CMF with indicators like MFI, OBV, and the Accumulation/Distribution line helps clarify where it works the best.
Difference Between CMF and MFI
| Feature | Chaikin Money Flow (CMF) | Money Flow Index (MFI) |
| What it measures | Tracks the volume-weighted flow of money to highlight accumulation or distribution | Measures momentum using price and volume to identify overbought or oversold conditions |
| How it is calculated | Looks at where price closes within the high–low range and weights it by volume | Compares positive and negative money flow derived from price and volume |
| Indicator type | Accumulation and distribution indicator | Momentum oscillator |
| Best used for | Confirming trend strength and spotting potential trend reversals | Identifying price corrections and momentum-based reversals |
In simple terms, CMF tells you whether money is flowing in or out, while MFI helps gauge how stretched a move may be.
CMF Compared with OBV and A/D
| Feature | Chaikin Money Flow (CMF) | On-Balance Volume (OBV) | Accumulation Distribution Indicator |
| Core focus | Measures money flow by combining volume with the closing position in the day’s range | Tracks volume flow based on whether price closes higher or lower than the previous day | Tracks cumulative money flow, giving more weight to high-volume days |
| Calculation approach | Uses closing price relative to high–low range, multiplied by volume | Adds or subtracts volume based on daily price movement | Weights volume by where price closes within the range |
| Sensitivity | Responds closely to changes in both price and volume | Can generate more noise as it depends heavily on closing-price changes | Sensitivity is similar to CMF, as both rely on price position within the range |
| Practical use | Helps judge trend strength and early reversals | Useful for spotting price–volume divergences | Helps confirm trends and identify accumulation or distribution phases |
Overall, CMF sits between OBV and A/D in terms of responsiveness. It offers more context than OBV by accounting for price position, while remaining easier to interpret than cumulative volume-based measures.
Practical Examples & Case Studies
Let’s see a practical example of Chaikin Money Flow using Reliance Industries Limited’s 1-month chart in a 30-minute interval.
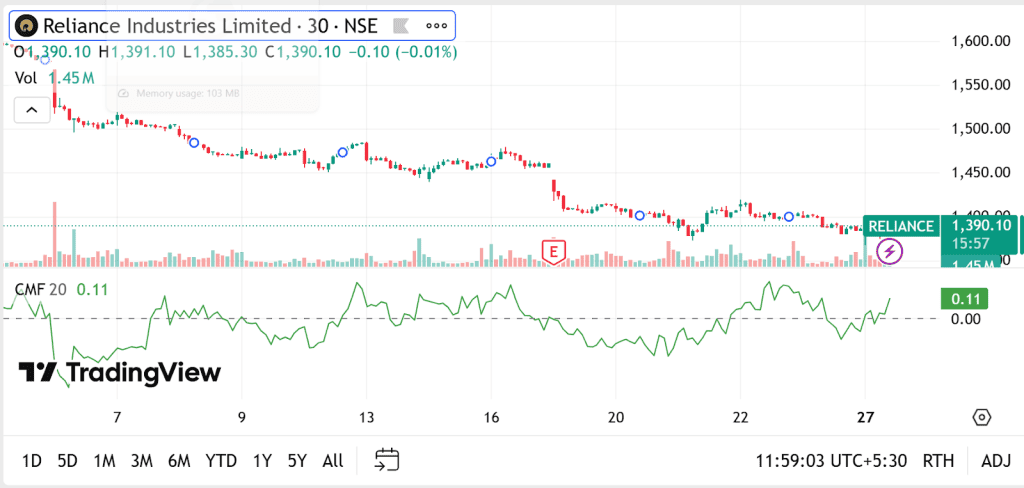
- On this 30-minute chart of Reliance Industries, the fall in prices from the ₹1,520-₹1,540 level in the initial days of the month to the ₹1,380-₹1,400 level is evident. The pattern indicates a consistent fall in prices with lower highs and lower lows.
- During this phase, the CMF (20-period) remains mostly below zero, confirming that selling pressure dominates volume activity. Short rebounds fail to gain momentum, with CMF repeatedly slipping back into negative territory.
- Toward the end of the chart, CMF turns positive near +0.11 as price stabilises around ₹1,390, suggesting easing selling pressure and early signs of returning buyer interest.
Common mistakes & limitations of the CMF indicator
Chaikin Money Flow can be insightful, but like any indicator, it has weaknesses that traders need to recognise before relying on its signals.
- Sensitivity to range-bound conditions
In sideways or highly volatile markets, CMF can oscillate frequently around the zero line, producing short-lived signals with limited directional follow-through. - Lag due to historical inputs
CMF is derived from past price and volume data, causing it to respond after a move has already developed rather than anticipating future price action. - Incomplete treatment of price gaps
The indicator’s calculation does not fully incorporate large price gaps from prior sessions, which can temporarily distort readings and overstate buying or selling pressure. - Using CMF in Isolation
CMF makes the most sense when it’s viewed alongside the broader trend and a few supporting indicators. On its own, it can send mixed signals, but with context, it becomes far more reliable and easier to interpret.
Bottom line
By evaluating the price and volume data, CMF assists in identifying the true force behind a market movement. It reveals whether there is genuine buying or selling interest or merely a superficial market action. When combined with other technical analysis tools, CMF assists in noise reduction and promotes more composed and disciplined trading actions rather than emotional ones.
FAQs
The Chaikin Money Flow indicator is a technical tool that combines price and volume to show whether buying or selling pressure is stronger. It looks at where a stock closes within its daily range to judge whether money is flowing in or out.
CMF is useful for understanding market pressure, but its reliability depends on conditions. It works best in trending markets and can give misleading signals during sideways or highly volatile phases.
CMF can be used for both intraday and longer-term analysis. Intraday traders often use shorter look-back periods, while positional or long-term traders prefer the standard 20–21 day setting.
CMF is used for trading purposes by observing the crossing and divergence to identify any variation in the buying and selling pressure. Such signals are usually combined with other indicators to make a decision on whether to enter, exit, or prepare for a reversal.
CMF is concerned with accumulation and distribution through price and volume, while MFI is a momentum indicator that shows overbought and oversold levels. They are used for different purposes, but can be combined for analysing a stock’s trend.