
Classic chart patterns don’t always work the way they used to. Markets evolve. Fakeouts are common. And the head and shoulders pattern once seen as a strong signal often doesn’t behave as expected. This blog explains what happens when it fails. More importantly, it shows how the failed head and shoulders pattern can itself become a tradable setup. If you’re tired of being wrong-footed by chart patterns that used to work, this blog will help you understand how to identify it, what it means and how to trade it.
What is a Failed Head and Shoulders Pattern?
A failed head and shoulders pattern occurs when the price breaks the neckline but reverses upward instead of continuing the expected bearish trend. This reversal cancels the expected bearish outcome and often leads to a sharp upward move, catching many sellers off guard.
What is a Head and Shoulders Pattern?
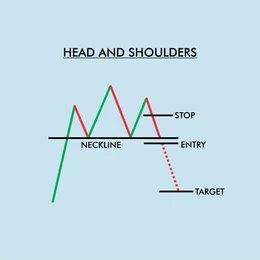
The head and shoulders formation is a chart-based technical indicator which usually emerges after an upward move. It consists of three peaks, with a taller middle one between two smaller peaks. The left and right peaks are the “shoulders,” and the highest one in the center is the “head.” This pattern is commonly linked with a possible move lower if confirmed.
How Does a Typical Head and Shoulders Pattern Work?
This candle stick pattern builds as the price rises and starts to lose strength. After the initial high (the left shoulder), the price tends to pull back. Then comes a higher peak (head), followed by another dip and a final lower peak (right shoulder). A line is drawn connecting the dips, called the neckline. If the price falls below this line, it signals selling pressure dominates.
Reasons Why the Head and Shoulders Pattern Fails
Here are the reasons why the pattern might not play out as expected:
- A good news or broad market recovery can override the bearish setup, attract more buyers and lift prices.
- A strong underlying uptrend can absorb the selling pressure completely, preventing a meaningful breakdown.
- Traders who went short expecting a breakdown will exit their positions as soon as the price goes up, creating more buying pressure.
- A breakdown with low volume may not have enough strength, making it easy for buyers to take control and push prices up.
How to Identify a Failed Head and Shoulders Pattern
Look for these signs to identify a failed head and shoulders pattern:
- Initial formation: A visible head and shoulders forms after a price rise, with the classic three-peak structure and a neckline connecting the lows.
- Neckline test: The price drops from the right shoulder and touches the neckline but doesn’t hold below it or lacks strength in the breakdown.
- Upward reversal: Instead of going lower, the price goes back above the neckline, showing the earlier breakdown failed. This recovery can sometimes resemble early stages of a cup and handle formation if it consolidates near recent highs.
- Confirmation: A clear move above the high of the right shoulder confirms the pattern has failed and the down move has been invalidated
Example Chart of a Failed Head and Shoulders Pattern
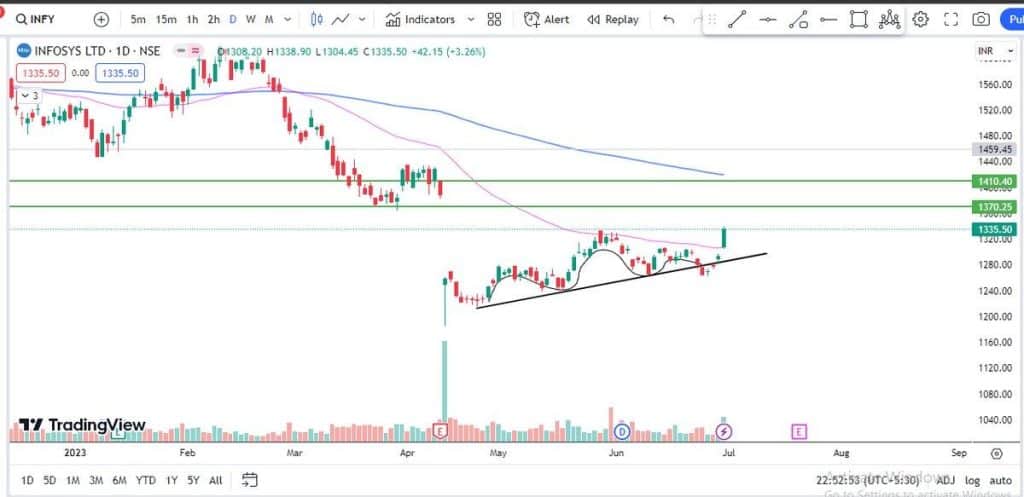
For example, the Infosys Ltd. chart below shows a failed head and shoulders pattern. In May and June 2023, the stock formed the bearish pattern with the upward sloping trendline as the neckline. Instead of breaking down as a head and shoulders pattern would suggest, the pattern failed.
This failure occurred on June 30, 2023 when a big bullish candle broke out to the upside, invalidating the bearish signal and showing strong buying pressure again.
How to Trade a Failed Head and Shoulders Pattern
This pattern can be used in both swing trading and intraday trading, depending on the timeframe and strength of the reversal. Here’s how to trade a this pattern step by step:
- Spot the failure clearly: Begin by checking if the price fails to stay below the neckline after dropping from the right shoulder. A close back above the neckline is the first sign that the pattern may not hold.
- Wait for confirmation: To reduce false signals, look for the price to close above the high of the right shoulder. This offers protection in case the price drop resumes instead of reversing.
- Plan the entry: Once confirmation is seen, prepare to enter the trade. The entry can be taken after a strong candle closes above the neckline or the right shoulder’s high, depending on your comfort with risk.
- Set a stop-loss: Place a stop-loss slightly below the most recent low, such as the low of the right shoulder or the neckline reversal point. This helps protect against further downside if the reversal fails.
- Calculate a target: Take the gap between the head and neckline, then project the same gap upward from the breakout area. This gives a basic estimate for booking gains.
Risk Management When Trading Failed Patterns
Some of the most helpful ways to control risk when trading failed patterns include:
- Always place a stop-loss to limit losses if the market moves unexpectedly.
- Wait for strong evidence of failure such as a candle closing above resistance before acting.
- Check the reversal volume. A rise in stronger volume is generally seen as more convincing.
- Limit trade size in proportion to account size to prevent large losses on a single trade.
Head and Shoulders vs Failed Head and Shoulders
The core difference lies in what happens at the neckline, whether it collapses or stays intact. So, let’s see how they differ:
| Feature | Head and shoulders | Failed head and shoulders |
| Outcome | Price falls past the neckline and declines further. | Price fails to break below and instead breaks above it. |
| Signal | Bearish (signals a potential downtrend). | Bullish (signals a potential uptrend or continuation). |
| Implied psychology | Sellers have successfully taken control from buyers. | Buyers have reasserted control, trapping early sellers. |
| Neckline behavior | Acts as a floor that breaks down. | Acts as a floor that holds and reverses price. |
| Volume pattern | Volume often decreases during the right shoulder and rises on breakdown. | Breakdown may occur on low volume; volume rises on reversal. |
| Trader reaction | Short positions initiated after neckline break. | Short covering and fresh buying occur after invalidation. |
Common Mistakes to Avoid
Avoid making these common errors when dealing with a failed head and shoulders pattern.
Watch out for these common mistakes while trading the failed head and shoulders pattern:
- Entering a long position before the breakdown has clearly failed and the price has reversed.
- Ignoring trading volume, especially when buying into a reversal that isn’t supported by higher volume.
- Sticking with a bearish view even after the price has invalidated the pattern.
- Not using a stop-loss, which leaves the trade exposed if the price drops again.
- Mistaking small movements near the neckline for a full failure, leading to premature entries.
Conclusion
A failed head and shoulders pattern may seem like a mistake at first, but it often shows something more important: a change in control. When the breakdown doesn’t hold, sellers exit, and buyers take over. Spotting this failure and managing it with structure, entry, stop-loss, and target can help handle setups that don’t behave as expected.
FAQs
A head and shoulders can fail due to weak volume on the breakout, wrong neckline placement or if the overall market trend is too strong against the reversal. False signals or sudden news can also cause failure.
A failed head and shoulders pattern usually becomes bullish if the price breaks back above the neckline after initially breaking down. It suggests the expected bearish reversal didn’t happen, and buying pressure may be increasing.
You can tell if a head and shoulders pattern has failed if the price moves back above the neckline after a breakdown or if it doesn’t continue in the predicted reversal direction within a reasonable time. Lack of confirming volume also signals failure.
A regular head and shoulders reversal sees a sustained price move in the opposite direction after the breakout, a failed one sees the price go back above the neckline, invalidating the reversal and sometimes resuming the original trend instead.
Yes, a failed head and shoulders can be profitable if you recognize the failure early and go long anticipating the trend to continue rather than reverse. Proper risk management and confirmation is key to success in such cases.