What happens if you don’t check the key warning signs in trading? Suppose you’re holding a stock that looks strong, but suddenly it reverses. Or you sell too early, only to watch it rally minutes later.
These kinds of mistakes happen when traders overlook clues from candlestick patterns like the Hammer and Hanging Man. So, what exactly are these? Let’s discuss it here!
What is a Hammer Candlestick Pattern?
A Hammer candlestick can be seen after a price falls for a long time. It tells you that selling pressure was strong during the day, but buyers came back near the close and pushed the price upward.
It looks in the following manner:
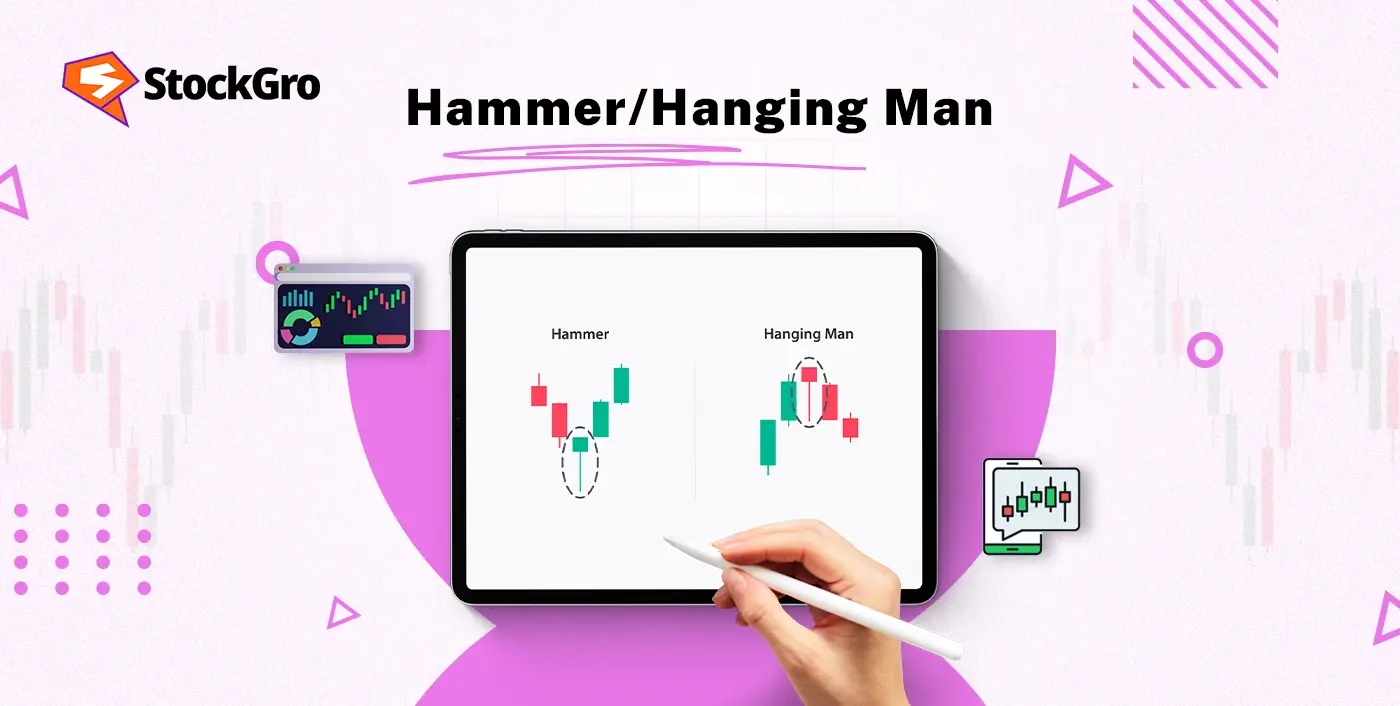
- The body of the candle is small and appears near the top.
- The lower wick is twice the body’s height.
- There’s no wick on the top.
What is a Hanging Man Candlestick Pattern?
A Hanging Man candlestick pattern can be seen when the prices rise for a time span. It looks like the Hammer, but its meaning is the opposite. It’s a warning sign that buyers are losing momentum.
How it looks:
- A small sized body on the top.
- A long lower wick having a bigger size than the body.
- Very little or no upper shadow.
Key Differences: Hammer vs Hanging Man
| Feature | Hammer Pattern | Hanging Man Pattern |
| Market Context | Appears after a downtrend | Appears after an uptrend |
| Meaning | Signals a possible bullish reversal | Signals a possible bearish reversal |
| Trader Action | Traders may prepare to buy or hold long positions | Traders may prepare to sell or go short |
| Structure | Small sized body on the top | Small body and big bottom wick |
| Color of Candle | Can be green or red | Can also be green or red |
| Upper Shadow | Very small or none | Very small or none |
| Confirmation Needed | Look for next candle to be bullish | Look for next candle to be bearish |
| Location on Chart | Seen near support levels or bottoms | Seen near resistance levels or tops |
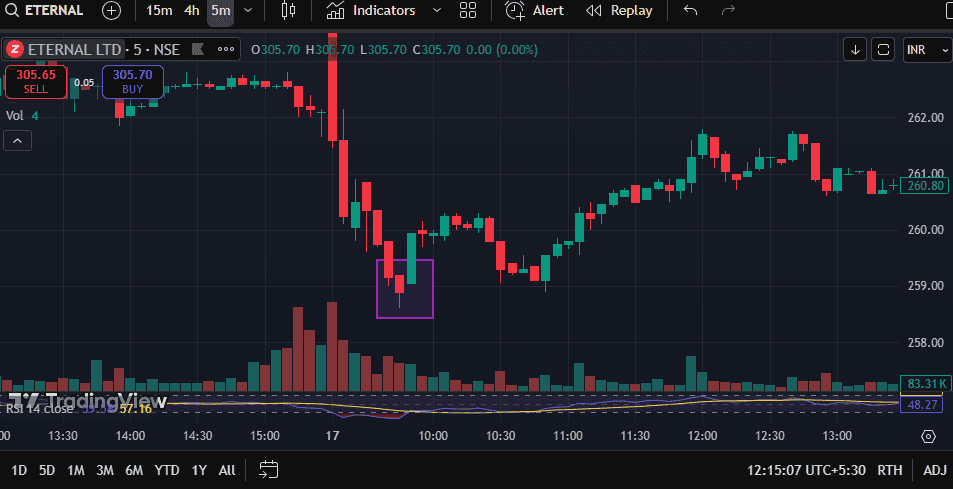
Hammer & Hanging Man Chart Examples
Below is the example of Hammer Pattern. In a 5-min timeframe, it could be clearly seen that Eternal stock was sold during the morning session. But after reaching a support level at ₹258.60, a hammer candlestick was formed and the stock gained upward momentum.
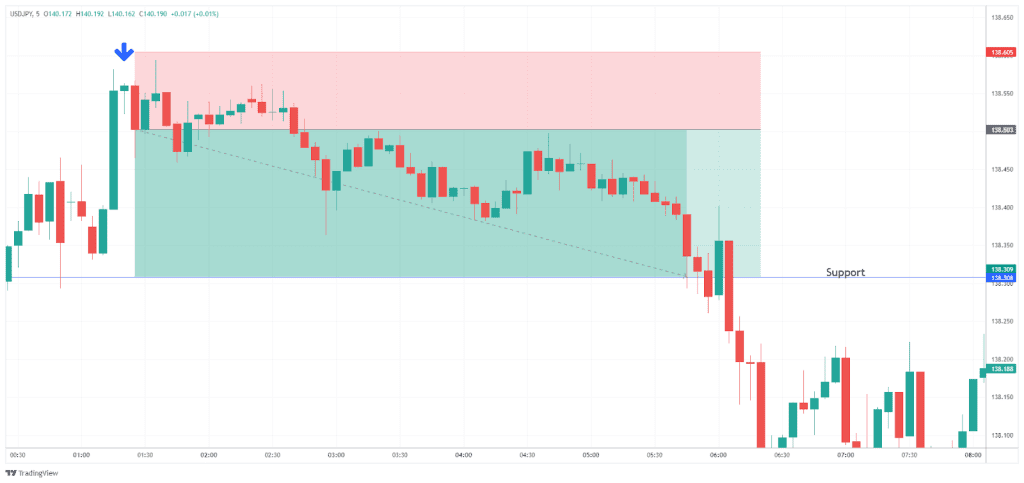
Here’s how the hanging man pattern plays out in the USDJPY forex pair. Once the hanging man candle forms, a sell entry is placed when the next red candle appears. The target is the next support level, shown by the orange line.
Common Mistakes when Trading Hanging or Hammer Man
These are the mistakes you might make while trading with Hammer and Hanging Man Pattern.
1. Jumping In Without Confirmation
One of the biggest errors is seeing a hammer or hanging man and rushing into the trade. You must wait for a strong next-day move. Without that follow-through, the pattern loses its value.
2. Ignoring Volume
A hammer or hanging man with low volume is weak. But if there’s a volume higher than the previous few candles, that’s a more dependable sign that market sentiment is shifting.
3. Trading in the Wrong Trend
A hammer is useful only after a downtrend. A hanging man means something only after an uptrend. Getting this backward leads to confusion and losses.
4. Blindly Trading Every Pattern
Not every hammer or hanging man is worth trading. Trying to catch every one can hurt more than help. You need clear trends, key price levels, and confirmation.
5. Skipping Stop-Losses
A reversal may look good, but if the next few candles turn against you, you need to cut the trade. Placing stop-losses just below the hammer or above the hanging man protects from sharp moves in the wrong direction.
Advantages & Limitations of Hammer & Hanging Man Patterns
Let’s see the advantages and limitations of both Hammer and Hanging Man candlestick patterns.
Advantages of Hammer & Hanging Man Patterns
- These patterns are not hard to recognize. You’ll see a small body with a big wick at its bottom.
- A hammer at the bottom often hints that buyers might be coming back after a fall. A hanging man at the top may show that buyers are getting tired.
- When seen at strong price zones (like support or resistance), they become even more useful.
- You can spot them on a 5-minute timeline. That makes them useful for short trades and long trades too.
Limitations of Hammer & Hanging Man Patterns
- Sometimes, the trend keeps going and ignores the candle completely.
- If you don’t check where it appears in the trend, you might read it wrong.
- These candles don’t work well in the middle of nowhere. They need to appear near important price levels.
Related Candlestick Patterns
Know the related candlestick patterns to avoid losing profitable trades.
1. Doji
This candle looks like a tiny cross or plus sign. The high and low prices remain similar, with shadows stretching above and/or below. When you see a Doji after a strong uptrend or downtrend, it’s a hint that the momentum may be settling.
2. Inverted Hammer
This one shows up after a market has been falling for a while. You will see that it arises with a short body and a big upper candlestick wick. Inverted Hammer signals a possible reversal but if the next candle shows real buying.
3. Shooting Star
This one appears after a strong rise in price. It looks just like an inverted hammer and happens at the top. Shooting Star pattern means that buyers are pushing the prices higher, but sellers have pushed it back.
Conclusion
The Hammer and Hanging Man are helpful patterns that work the best when used with price zones, trendlines, and volume. Both look nearly the same, but what they tell us about the market is completely different. They can help you spot possible reversals early.
FAQs
These patterns show how buyers and sellers fight during the day. A Hammer shows sellers tried to pull prices down but buyers came back strong. A Hanging Man means the market rose, but there was strong selling pressure.
Yes, but you must add volume and confirmation before reacting. In intraday setups, these candles work best near support or resistance zones. A hammer near day’s low with rising volume might give a strong long setup.
They are helpful but not always right. Their accuracy improves when you add volume, support-resistance zones, or trendlines. A hammer alone doesn’t mean you buy right away.
These patterns work well on the daily chart because it filters out random price noise. For short-term moves, you can try 15-minute or hourly charts. Just make sure the pattern forms after a strong trend and shows clear rejection.
To trade a hanging man pattern, first ensure it appears after a strong uptrend. The hanging man has a small body at the top and a long lower shadow. Traders usually wait for confirmation — such as a bearish candle closing below the hanging man’s body — before entering a short position. A stop-loss is typically placed above the high of the hanging man to manage risk.
A red hanging man means the candle closed lower than it opened. It strengthens the bearish signal because it shows selling pressure by the end of the session. However, confirmation from the next candle is still important before taking action.
Both patterns look similar with small bodies and long lower wicks. The key difference is context. A hammer appears after a downtrend and signals a potential bullish reversal. A hanging man appears after an uptrend and signals a potential bearish reversal.
There is no standard technical term called “inverted hanging man.” If a candle has a small body with a long upper shadow after an uptrend, it is generally referred to as a shooting star, which is a bearish reversal pattern.