
Markets in a strong uptrend often leave traders questioning when the momentum will fade. A stock may continue rising for days, only to suddenly reverse. In such moments, candlestick patterns can provide useful visual clues. One such pattern is the shooting star candle, often associated with potential trend weakness. This blog discusses how it forms, its benefits, limitations and more.
What is the Shooting Star Candlestick Pattern?
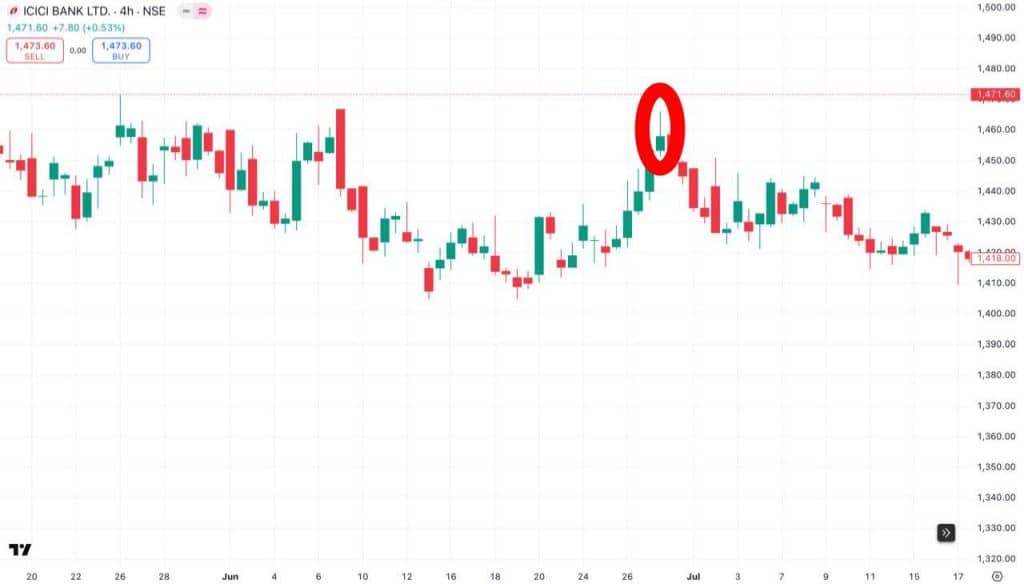
A shooting star candle stick is a single-candle pattern that appears when the price rises sharply during a session but then falls back down, closing near where it started. The candlestick pattern displays a narrow real body positioned at the lower end of the range, topped by an extended upper shadow. This setup usually appears after a price rise and can indicate that bullish momentum is slowing. The upper wick must be at least half the candle’s full length to qualify as a shooting star.
Things to know before trading with Shooting star candlestick
Before using the shooting star candle, keep these key points in mind:
- Trend context: Verify the candle forms after a clear, sustained up‑move; otherwise, its bearish implication weakens.
- Confirmation: Wait for a lower close or another bearish signal in the next session to avoid reacting to noise.
- Volume factor: A noticeable jump in volume during formation often adds weight to the potential reversal narrative.
- Risk control: Position size conservatively and place a predefined stop‑loss above the pattern’s high to cap losses.
- Indicator support: Cross-check with RSI, moving averages, or nearby resistance zones to strengthen conviction.
- Trade reviews: Track outcomes, separate winners from false signals, and adapt rules for continuous improvement.
Example of Shooting Star Pattern
Now that we have some basic understanding of the concept, let’s take a look at an example to understand its mechanics in a trading setup.
Let’s say a stock climbs steadily from 180 to 210 over a few sessions, showing strong upward traction. On the next trading day, it opens higher at ₹212, continues upward to ₹218 during the session, but faces strong selling pressure in the second half.
Despite reaching a high during the day, it ends around 209, well below its intraday peak. This creates a candlestick with a small body near the low and a pronounced upper shadow, giving it a shooting star appearance.
The following day, a bearish candle forms and closes below ₹209. This move confirms the rejection of higher prices, and some traders may interpret it as a signal of possible trend reversal or weakening momentum. The pattern tends to carry more weight if it occurs close to a known resistance area.
How to Trade Using the Shooting Star Candle?
Just identifying the pattern visually isn’t enough, understanding how to trade is equally important. Here’s how to use it in a trade the right way:
- Spot the formation
Look for a single candle with a long upper wick, small real body, and little or no lower wick, typically forming after an upward price move.
- Wait for supporting signals
The pattern may be considered stronger if followed by a bearish candle or a drop below the shooting star candle’s low. Some also watch for increased volume or use indicators like RSI or MACD.
- Decide when to enter
Some traders act immediately after the pattern forms, while others wait for further signs, such as a follow-up bearish candle or a break below support.
- Set the exit strategy
Common exit methods such as placing a stop-loss above the high of the candle and targeting nearby support zones or using a trailing stop-loss strategy.
How to confirm the Shooting star candle?
In order to confirm the shooting star candle pattern, merely identification through its shape is not enough. Traders usually look for supporting signals to validate its authenticity as a bearish reversal indicator.
- Volume analysis: Higher-than-average volume during the candle’s formation may reflect strong market activity, suggesting possible exhaustion of the uptrend.
- Next candle confirmation: It appears as a short-bodied candlestick with a tall wick reaching upward, and almost nothing extending below.
- Technical indicators: Tools like RSI or stochastic oscillator can highlight overbought conditions, aligning with the reversal setup.
- Resistance zones: If the shooting star forms near a known resistance level, it may hint at a failed breakout attempt.
- Swing high rejection: A wick breaching a swing high before closing lower might indicate a stop-loss hunt, often seen before a downturn.
- Trend context: Alignment with broader market trends or sentiment can improve pattern reliability in technical analysis.
Advantages and Disadvantages of the Shooting Star Pattern
The shooting star candle pattern comes with its own set of pros and cons.
Some of the core advantages of the shooting star candle are:
- It is easy to spot on price charts due to its distinct structure, a small real body near the lower end and a long upper wick.
- Its clarity makes it easier for beginners to spot without deep technical knowledge.
- It often hints at selling pressure near the top, which could indicate the beginning of a downward trend.
However, the pattern also has a few drawbacks:
- It may produce false signals, as price movement doesn’t always reverse after a shooting star candle appears.
- It also requires confirmation from subsequent candles or additional indicators, as relying on it alone may increase the risk of incorrect assumptions.
What is the Difference between Shooting Star Pattern and Inverted Hammer Pattern?
The shooting star and inverted hammer patterns appear visually similar, featuring small bodies with long upper wicks. However, they differ in their placement and market setting. A shooting star forms after an upward price move and may suggest potential weakness in buying pressure. Whereas, an inverted hammer appears after a downtrend, implying that buyers attempted a reversal, though sellers pushed the price back down. Both patterns display rejection at higher levels, but their interpretation depends on prior price direction, increasing before a shooting star and falling before an inverted hammer. The market setting is key in distinguishing them.
Conclusion
The shooting star candle stick is a simple yet commonly observed pattern that reflects hesitation or rejection near market highs. While it visually stands out on the chart, its meaning depends heavily on the surrounding trend and price action. Used thoughtfully and with supporting signals, the shooting star candle can add value to technical analysis in spotting possible reversals.
FAQ
A shooting star is usually confirmed by checking for further signs of selling pressure. These include:
A strong bearish candle following the shooting star that closes below its low.
The pattern appears after an uptrend or near resistance levels.
Increased trading volume during the shooting m ko star or the next candles.
Technical indicators like RSI or MACD showing weakness or a possible downward move.
A shooting star signals a potential bearish reversal after a prior uptrend. It suggests that buyers pushed the price higher during the session, but sellers regained control and pushed the close near the open. This loss of bullish momentum points to possible downward price movement ahead and a weakening of the current uptrend.
The pattern opposite to the shooting star is the inverted hammer. While both patterns look visually similar, the shooting star appears after an uptrend and signals a bearish reversal, whereas the inverted hammer appears after a downtrend and suggests a possible bullish reversal.
The opposite pattern is the inverted hammer. While the shooting star forms after an uptrend and signals a bearish reversal, the inverted hammer appears after a downtrend and suggests a potential bullish reversal. Both have a long upper shadow and small real body, but their market contexts and implications differ.
The shooting star is generally considered a reliable reversal pattern, but not a guarantee. Historical testing suggests a reliability of around fifty seven percent with better performance when confirmed by other bearish signals and volume. Its effectiveness increases near resistance levels and after prolonged uptrends. However, relying solely on this pattern may result in false signals, so confirmation is important.
The shooting star pattern can appear on any timeframe, but higher timeframes, including as daily charts are generally favored for their more reliable signals and reduced market noise. Patterns on these longer timeframes provide a clearer indication of broader market sentiment and tend to minimize false reversals that are more common on shorter intervals like 5 or 15 minutes.
The opposite of a shooting star candlestick is the inverted hammer when it appears after a downtrend. While a shooting star signals a potential bearish reversal after an uptrend, an inverted hammer suggests a possible bullish reversal after a downtrend.
A shooting star is usually considered a bearish reversal pattern, but sometimes traders refer to a “bullish shooting star” when the price breaks above the shooting star’s high in the next sessions, invalidating the bearish signal and continuing the uptrend.
Common variations include:
Classic Shooting Star – Appears after an uptrend with a long upper shadow and small body.
Bearish Shooting Star – Confirms a potential price reversal downward.
Failed Shooting Star – When the price moves higher instead of reversing, invalidating the bearish signal.
The shooting star pattern can appear in any type of stock, including large-cap, mid-cap, or small-cap stocks. However, it is more commonly seen in stocks experiencing strong upward momentum or nearing resistance levels, where selling pressure starts to appear.

