Being successful in trading does not only mean selecting the right asset; it also means managing risk effectively. Stop loss safeguards the capital, limits the impact of emotional trading, and fine-tunes your trading approach. It is important to understand how to calculate and determine stop losses, even if you are an experienced trader or a beginner.
What is a stop loss in trading?
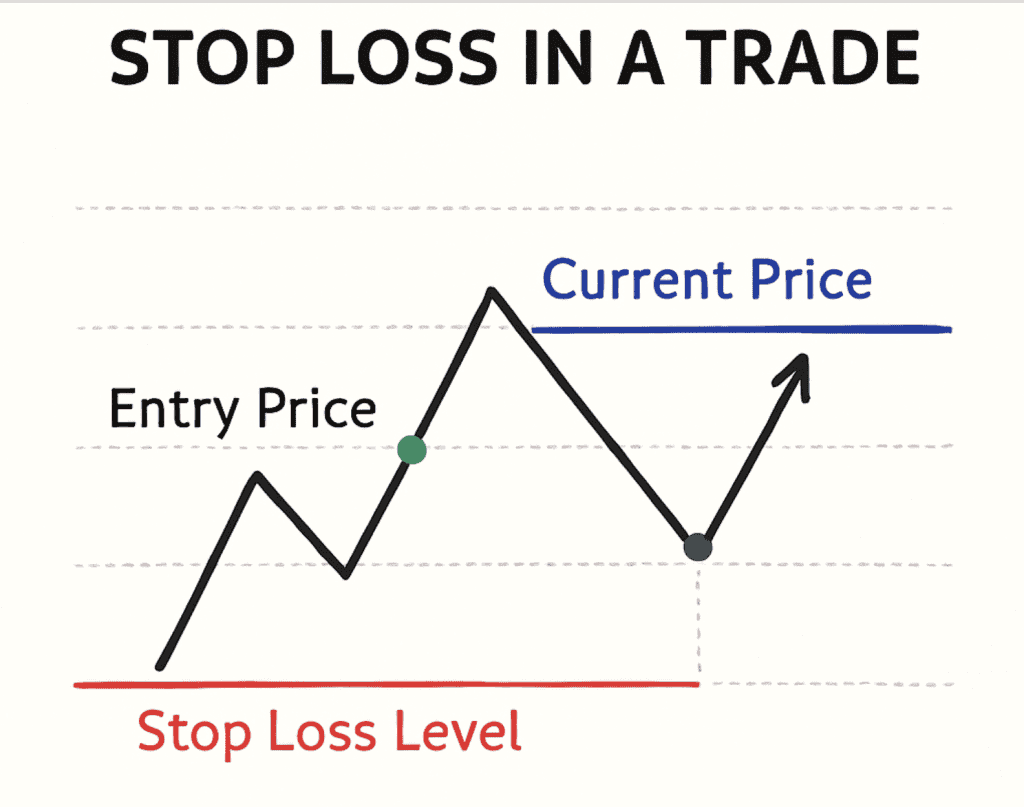
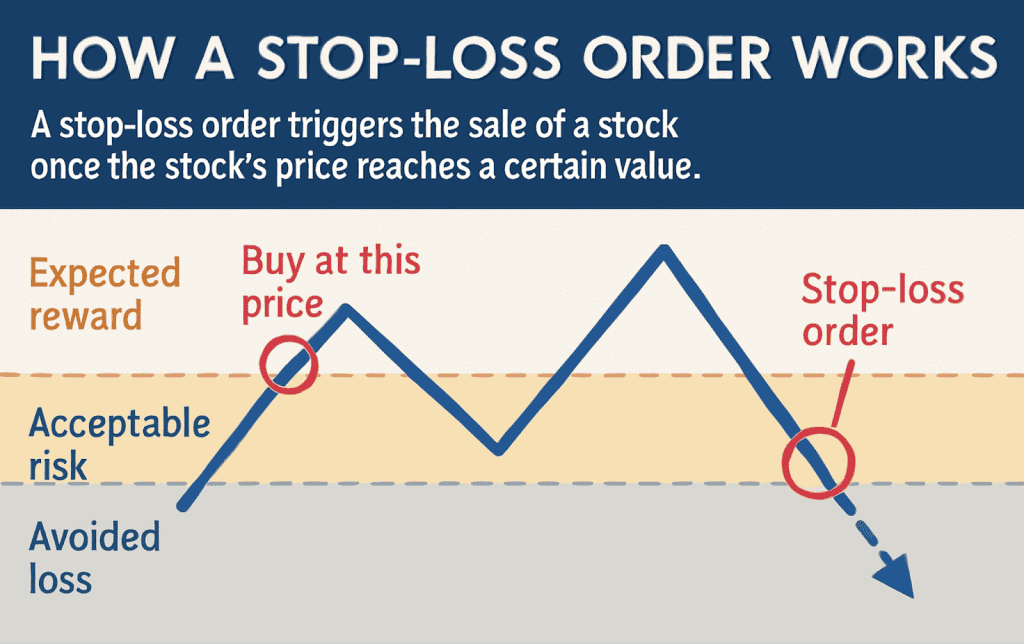
A stop loss is a predetermined amount or number in a trade, beyond which a trader must leave a position to avert additional losses. It is a risk management strategy that helps traders mitigate their losses in case the market goes against their plan. It is an automatic (or manual, depending on the preference) action to exit a trade at a particular price rather than wait and watch a losing situation increase further.
Why is calculating stop loss important?
Calculating the stop loss according to the trade is essential because:
- It limits potential losses before they become too risky to manage
- It removes emotions from trading decisions.
- It preserves the trading capital, especially in volatile markets.
- It helps you define your risk and rewards before entering a trade.
Without a stop loss plan, traders may hold onto losses, hoping the market will bounce back. But mostly it leads to more losses.
How to calculate stop loss
There are various proven ways to calculate the stop loss in a trade. These are some important methods to learn for technical analysis. Let’s look at the most popular ones:
- Percentage-based stop loss calculation
Percentage-based stop loss method is used by setting up a stop loss at a chosen rate below the rate at which you bought the security. A common practice is to keep the stop loss rate at 1%-3%, depending on the trade. Here’s how it is calculated:
Formula- Stop Loss Price = Entry Price × (1 – Stop Loss %)
- Support and resistance-based stop loss
In this approach, stop loss is placed just below a support line for buying trades or above a resistance line for selling trades.
Support is the price point where buying power is strong enough to halt downward movement. Resistance is where the selling force usually stops the upward movement.
- Volatility-based stop loss (ATR method)
The Average True Range (ATR) or volatility-based stop loss is based on the movement of the stock or market. Instead of placing a fixed stop loss, this method adjusts the stop loss based on the volatility of the stock. If a stock moves a lot daily, the stop loss will be more. If it moves less, the stop loss will be less.
Formula- Stop Loss = Entry Price – (ATR × Multiplier)
4. Moving average-based stop loss
Under this technique, a stop loss is placed under moving average lines like the 50-day or 200-day. When stock prices fall below these averages, it’s commonly seen as an exit signal.
How to calculate stop loss for stocks
The choice of stop loss method depends on the trading plan and how much risk you can handle. Long-term investors usually prefer support levels or moving average lines. Short-term traders usually apply percentage-based or ATR methods. Before making a trade or stop loss strategy, always keep track of the movement of the stock and the risk involved.
How to calculate stop loss for intraday trading
Intraday traders usually prefer fast trade execution. Therefore, they commonly depend on methods like:
- Tight percentage-based stops (1–2%)
- ATR-based stops on lower time frames
- Support/resistance from intraday charts
For intraday trading, quick adjustments are necessary as price action can change rapidly during the trading session.
How to calculate stop loss for swing trading
Swing traders generally hold onto their positions for days to weeks. Their stop loss strategies include:
- ATR method on daily charts
- Support and resistance from previous highs/lows
- Stops below recent consolidation zones
Swing trading allows more flexibility, so the stop loss is often wider than in intraday trades.
Examples of stop loss calculation
- Using the percentage method
Formula- Stop Loss = Entry Price – (ATR × Multiplier)
You purchase shares at ₹200 and decide to risk 3%.
Stop Loss = ₹200 × (1 – 0.03) = ₹194
- Using the ATR method
Formula- Stop Loss = Entry Price – (ATR × Multiplier)
You bought a stock at ₹100
ATR = ₹2 (the stock usually moves ₹2 up or down daily).
Multiplier = 1.5
Stop Loss = ₹100 − (₹2 × 1.5) = ₹100 − ₹3 = ₹97
- Using support/resistance
Stock is trading at ₹80
Nearest support is at ₹77
Set stop loss slightly below at ₹76.50
What is a stop-loss order?
A stop loss order is a predetermined order that gives your broker instructions to close off the position upon reaching a certain price. It ensures an automatic exit on the trade once the market reaches your desired level.
Types of stop loss Orders
- Stop market order: In this, once the stop price is triggered, execution occurs at the next available market price. While this method offers speed, it is susceptible to slippage.
- Stop limit order: This order type executes only at the specified limit price or better, once the stop price has been reached. While it protects against slippage, there is a risk that the order may not be filled.
- Trailing stop loss order: It tracks the price upward when you’re making money and protects your profits. If you have a 5% trailing stop on ₹100 shares, it will follow the stock up but won’t move down when prices fall.
Trigger Price and Limit Price
- Trigger Price: The trigger price is the level that activates your stop-loss or stop-limit order. Only after this price is hit, your order enters the market.
- Limit Price: The limit price is the highest and lowest price you want to buy or sell at. It ensures you don’t trade beyond your acceptable price range.
Example of placing a stop order:
- Placing a buy stop order (To enter on a breakout or cover a short position)
A stock is currently at ₹85. You believe that if it crosses ₹90, it’ll give a breakout, so you want to buy only after breakout confirmation.
The order placed at the Trigger Price: ₹90
If the stock rises to ₹90, the stop order is triggered, and a market buy order is placed.
You may buy at ₹90.10, ₹90.50, depending on the market.
- Placing a sell stop order (To limit losses on a long position)
If you enter in trade at ₹150 and aim to control the loss when the price drops.
The order is placed at the Trigger Price: ₹135
If the price goes down to ₹135, the stop order gets triggered, and a market sell order is placed.
The stock will be sold at the next available price, maybe ₹89.80, ₹89.50, etc.
Tools to Help Calculate Stop Loss
There are various tools available online to help in calculating stop loss and managing risks:
- Trading platforms (like TradingView, Leverage trading, Zerodha)
- Position sizing calculators
- ATR indicators
- Stop loss plugins or scripts
Common mistakes in setting stop loss
Even experienced traders can make costly mistakes when placing a stop loss. Here are some common mistakes:
- Placing the stop-loss very close to the entry price can close the trade unexpectedly due to regular market movements, even if the overall trend is still in your favour.
- Every stock and market condition is different. Using a fixed percentage or strategy for all trades might not work.
- Ignoring upcoming news or high volatility can lead to bad stop placements and quick losses.
- Shifting your stop further after a loss starts only increases risk and breaks your plan.
- Setting stops randomly, not based on chart levels, makes them less effective.
How to adjust the stop loss during a trade
You can shift the stop loss to:
- Move your stop loss closer as the trade approaches your profit goal.
- Break-even point as the trade becomes profitable.
- Trail profits using a trailing stop method.
Smart stop-loss changes help lock in earnings while minimising the chance of losses.
Related risk management concepts
1. Risk-reward ratio
A risk-reward ratio is a setting of a potential reward vs. a potential loss. For example, A 3:1 ratio means your goal is to make ₹3 for every ₹1 risked.
2. Position sizing
The position sizing indicates the number of units of an asset you may buy based on your risk tolerance and stop loss size.
3. Take profit orders
Take profit levels are pre-set points at which you exit a trade to secure gains. While stop loss protects against downside, take profit ensures upside is locked in.
Placing the stop loss with a clear strategy can reduce the chances of losses in your trading journey. The key to a successful trade is understanding where to put the stop loss to avoid any unnecessary capital loss. Mastering this simple tool can make a big difference in your trading success over time.
FAQs
To calculate stop loss using percentage, decide how much of your capital you’re willing to risk (e.g., 2%). Use the formula:
Stop Loss Price = Entry Price × (1 – Stop Loss%) for long trades.
For example, if you buy at ₹1,000 and set a 2% stop loss, your stop price would be ₹980.
There’s no one-size-fits-all best method; it depends on your trading style. Intraday traders prefer percentage or ATR-based stops for speed, while long-term investors often use support/resistance or moving averages. The best method is one that aligns with your strategy, asset type, and risk tolerance, and that helps you stay disciplined without overreacting to market noise.
Beginners often start with a simple percentage-based stop loss, typically between 1%–3% of their entry price. This method is easy to calculate and helps limit losses. They can also use chart-based levels like recent lows (for long positions). Beginners need to test and refine their approach as they gain experience and understand market behavior.
Yes, adjusting stop loss can be a smart way to lock in profits or reduce risk, especially when the trade moves in your favor. Many traders shift their stops to breakeven or use a trailing stop to follow the trend. However, it should be done based on a clear strategy—not emotions—to avoid exiting trades too early.
The Average True Range (ATR) measures market volatility. Using ATR for stop loss helps place your stop at a distance that reflects how much a stock typically moves. This reduces the chance of getting stopped out by normal price fluctuations. The formula:
Stop Loss = Entry Price – (ATR × Multiplier), with a common multiplier being 1.5 or 2.
The trigger price is the level at which your stop-loss order becomes active. Once the market hits this price, your order is sent to the exchange as a market or limit order. It acts as the signal to exit a trade and helps automate your stop loss, ensuring quick action when the market moves against you.