One of the first tools you will come across when you start to explore virtual stock trading is the moving averages. They make price action more complex and improve trend identification. But not every moving average works in the same way. Traditional ones, such the SMA and the EMA, can lag behind the market or give cloudy signals for predictions.
That’s where Hull Moving Average (HMA) makes a difference. It was set with the objective of decreasing lag and enhancing accuracy without sacrificing smoothness. If you’re looking for a smarter way to understand price movements and make better trading decisions, the HMA is a good place to start learning.
What is the Hull Moving Average?
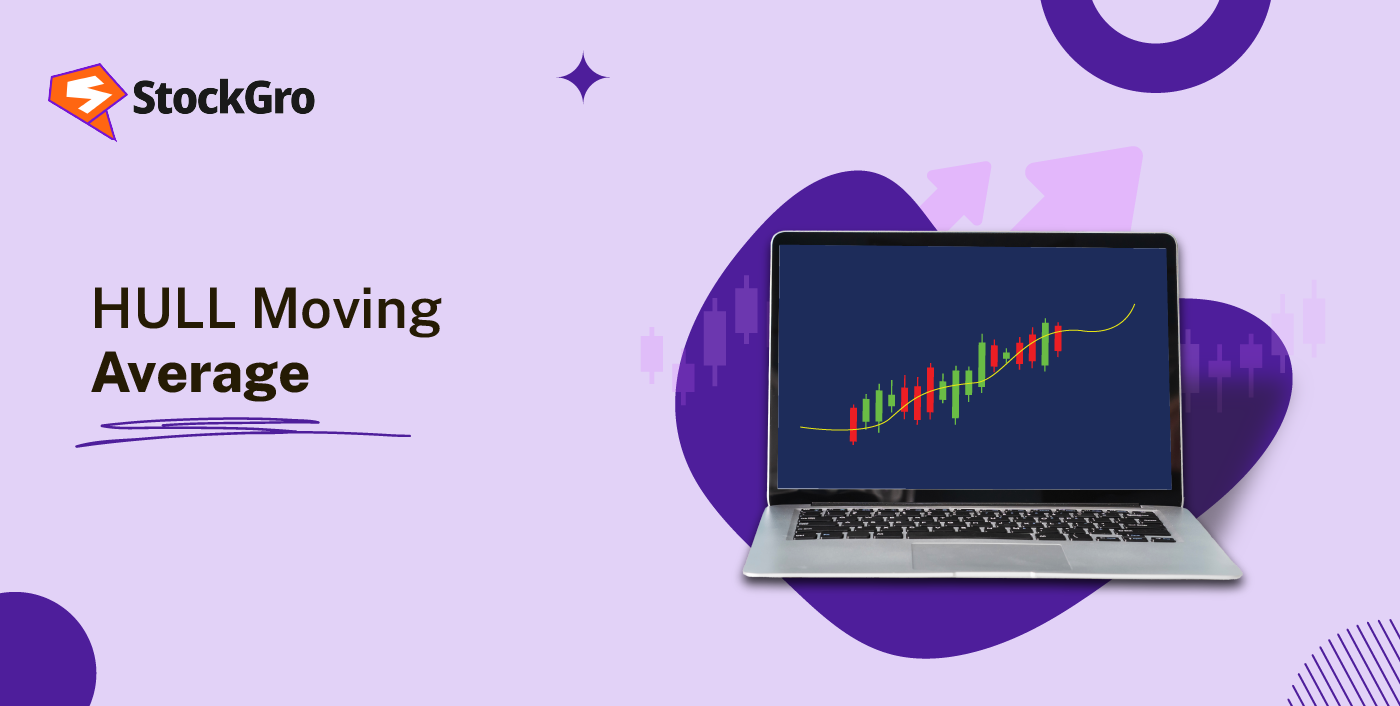
Hull Moving Average is a faster, smoother moving average designed to reduce lag, increase responsiveness, and smooth out price data to determine market trend. It is a variant of the moving average that attempts to overcome the shortcomings of the SMA and EMA. This technical indicator was constructed in such a way that it is speedier and responds quickly, yet retains the trend line’s smoothness. It provides more obvious signals to traders in technical analysis, particularly in growing markets where timing is crucial.
Who Developed the Hull Moving Average?
Alan Hull is the Australian trader and mathematician who created the HMA. He published this indicator in 2005, intending to minimise the delay, or what he referred to as the lag in the regular moving averages. The approach he introduced is a weighted moving average that is also combined with a special smoothing method, which makes the indicator very fast and clean. HMA has been popular among technical traders around the world ever since its introduction.
How Does the Hull Moving Average Work?
To understand the functioning of the HMA, it would be beneficial to familiarise ourselves with the causes of lag in moving averages. Most moving averages will weigh all prices equally or have more weight on more recent prices, but will lag behind period-to-period changes. This lag may delay trade entrance or exit.
It has a shorter lag by combining weighted moving averages with square roots. It will then build a half-period weighted moving average (WMA). And it deducts a periodic WMA. It lastly smooths this outcome with another WMA over the square root of the original period.
The HMA can respond more quickly to fluctuations in prices while still keeping a smooth curve thanks to this tiered approach.
Hull Moving Average Formula
Here’s the formula behind the Hull Moving Average:
HMA = WMA(√n) of [2 × WMA(n/2) – WMA(n)]
In simple terms:
- Consider a weighted average of the last n periods
- Take another weighted average of the last n/2 periods and multiply it by 2
- Increase half-period WMA and decrease full-period WMA.
- Use a square root of n period for a final WMA on this outcome.
With this, you get the Hull Moving Average line.
How to Calculate the Hull Moving Average
Let’s split this into smaller parts.:
- Choose a time period (say, 16)
- Work out the WMA of closing prices over 8 periods (n/2).
- Multiply it by 2.
- Calculate the closing price WMA across 16 periods (n).
- After doubling the 8-period, subtract the 16-period WMA.
- Use a 4-step WMA (√16) on the result.
Most trading platforms will do this automatically for you, but understanding the process helps when adjusting the settings to suit your trading style.
Best Settings for Hull Moving Average
Your trading strategy and timeframe determine the ideal HMA setting. Use a shorter period, such as 9 or 16, for short-term or intraday trading. For trading medium to long-term, a span of 50 or higher is commonly seen.
Smaller settings respond quicker to price changes in HMA. It can be good for picking up fast movements, but it may produce more false signals in a flat market. Longer adjustments give smoother signals but can be slower to react.
It is common practice to use a 16-period HMA when day trading on a 5-minute chart. For swing traders on a daily chart, a 50-period HMA is usually sufficient.
Hull Moving Average vs Simple & Exponential Moving Average
Here’s how SMA and EMA compare to HMA:
| Feature | Hull Moving Average (HMA) | Simple Moving Average (SMA) | Exponential Moving Average (EMA) |
| Speed of Reaction | Thanks to its weighted structure, it responds swiftly to fluctuations in price. | Responds slowly as all data points are equally weighted | Faster than SMA but slower than HMA |
| Smoothness | Offers a smooth curve with minimal noise | Can be choppy, especially in volatile markets | Smoother than SMA but not as smooth as HMA |
| Lag | Very low lag; designed specifically to reduce delay | High lag, especially over longer periods | Moderate lag – recent prices have more weight |
| Calculation Method | Weighted moving average with square root component | A simple average of prices over a selected period | The smoothing factor emphasises recent prices. |
| Best Use Case | Short- to medium-term trading, ideal for trend-following strategies | Long-term trend analysis and basic support/resistance levels | Suitable for swing and position trading with moderate trends |
In short, the HMA offers a good balance between speed and smoothness, which makes it more reliable in fast markets.
How to Use the Hull Moving Average for Trading
Traders can utilise the HMA in several ways:
- Trend Identification: Price above a rising HMA may signal an upswing. A downtrend is indicated when the price falls below the Hull Moving Average (HMA).
- Entry/Exit Signals: Price crossovers above or below the HMA might trigger trades.
- Support/Resistance: Additionally, HMA can function as a level of dynamic support or resistance where prices often retrace.
These signals are not perfect on their own, but they become more effective when combined with volume indicators, RSI, or MACD.
Hull Moving Average Trading Strategies
Here are some popular HMA strategies to consider as technical indicators:
1. HMA Crossover Strategy
Separate the HMAs into two shorter ones. The shorter HMA breaking above the longer HMA is a buy indication. Downward adjustments imply a sell. This method works in trending markets.
2. HMA and Price Action
Some traders neglect HMA and candy stick pattern. When price breaches the HMA after a bullish engulfing pattern, it may indicate a trend shift.
3. HMA with RSI
When HMA and RSI converge (e.g., RSI rises out of oversold conditions with a rising HMA), then it serves as confirmation of a trade.
4. HMA with MACD
Typically traders prefer to combine HMA with MACD to further validate the trend strength. Let’s take an example, if HMA is sloping upward and the MACD line crosses above the signal life it can strengthen the bullish signal.
Advantages of Using the Hull Moving Average
- Faster response: Because of the weighted and smoothed formula, HMA reacts to price changes quicker than SMA or EMA.
- Smoother trends: Despite being fast, HMA avoids the jagged lines that come with other fast-reacting indicators.
- Fewer false signals: It performs better in trending markets with less noise, which is helpful for beginner and intermediate traders.
Limitations of the Hull Moving Average
- Still lags slightly: Like all moving averages, the HMA is a lagging indicator and can miss the very beginning of a trend.
- Not ideal in sideways markets: It may give misleading signals when the market lacks a clear direction.
- Complexity: It’s a bit more complex than SMA or EMA, which might be confusing for absolute beginners at first.
Conclusion
No matter whether you are trading or planning actual investments, including the HMA in your set of tools can make a difference. Simply keep in mind that no indicator is flawless. It is advisable to use HMA in conjunction with other tools and test it on demo platforms before integrating it into actual trading. The HMA will enable you to cut through the noise, and make smarter trading decisions with proper settings and a strategy.
FAQs
Yes, Hull Moving Average (HMA) is very suitable for intraday trading due to its sensitivity and lesser lag. It is sensitive to price changes which aid traders in recognising short term trends and reversals early. This is perfect as it suits scalpers and day traders that require quick signals.
The most appropriate range of the Hull Moving Average is relative to your favoured style of trading. Shorter periods, such as 9, 14, or 21 on 5-minute or 15-minute charts, are more typical of intraday traders. Swing traders could like 55 or 89 in hour charts, whereas longer term traders can utilise 144 or above in the daily charts. The trick here is to experiment with alternative time frames to settle on the one that fits best with your strategy, where HMA can be customised to any time frame.
Absolutely. Hull Moving Average is effective when it is used in combination with other indicators of a technical nature. It can be used in conjunction with the Relative Strength Index (RSI) to confirm momentum, the MACD to determine the direction of the trend, or Bollinger Bands to seek signs of volatility. Combined with support / resistance levels or candlestick patterns, HMA can also be used to augment entry and exit timings. It aims to create confluence, the concept of two or more indicators pointing in the same direction, to ensure that you do not rely on any one signal, resulting in less risk.
Hull Moving Average is believed to be preferred by traders who are more focused on speed and flatness. It provides a quick response to change in prices with faster response time than the Simple Moving Average (SMA) and is less lagging than the Exponential Moving Average (EMA). This makes it suitable when trading. Nevertheless, SMA and EMA perform a certain role SMA is more consistent with long-term trends and EMA is often employed in crossovers.

