Ever noticed when the market seems to pause, like it’s catching its breath before zooming off again? That’s often when an inside bar breakout is about to happen. It’s a neat price pattern where a smaller candle hides completely inside the range of the previous big candle, almost like the market is taking a little time-out.
In this article, we will break down what an inside bar breakout really is, how you can spot it effortlessly on your charts, and why it could be your new favourite strategy.
What is an Inside Bar Breakout?
An Inside Bar Breakout occurs when price breaks above or below a smaller candle formed within the high-low range of the previous larger candle. It is a common technical analysis trading pattern.
This pattern implies that the market is taking a pause or settling down after a move. A breakout outside of the mother bar’s range means the next big price move is coming. The market seems to be taking a brief break before determining what to do next.
How Does an Inside Bar Breakout Form?
An inside bar occurs when the price action becomes more compact, remaining within the boundaries set by the previous mother bar. Think of it as the price moving between the high and low of the last candlestick. This usually happens when the market stops after a major price shift.
In breakout trading, this setup is essential because it can suggest that the trend is about to continue, or that a reversal might happen, especially near key levels like support or resistance.
Why Traders Use Inside Bar Breakout Strategies
Traders like this technique because it gives them a clear indication with a set risk and reward. When the price moves beyond the inside bar’s range, it frequently leads to significant fluctuations. This makes it easier to set stop losses just outside the mother bar, which keeps risk low.
It also works well with trend-following and reversal settings, giving traders a flexible option to locate trades that break out or reverse.
How to Identify an Inside Bar on a Chart
Look at any candlestick chart. An inside bar:
- Has a lower high than the high of the preceding candle
- With a lower low than the one from the preceding candle
In short, it’s a small candle inside a larger one. On some charting platforms, these patterns are marked automatically. On others, you can spot them with a quick visual scan.
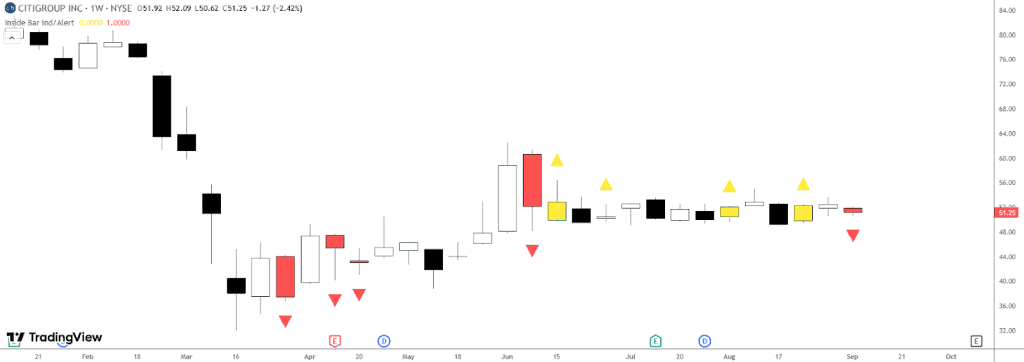
You will often see a series of inside bars in tight ranges. These are called “inside bar clusters” and suggest even stronger breakouts once the price finally makes a move.
Inside Bar Breakout Trading Rules
- Wait for the inside bar to form entirely within the mother bar’s range.
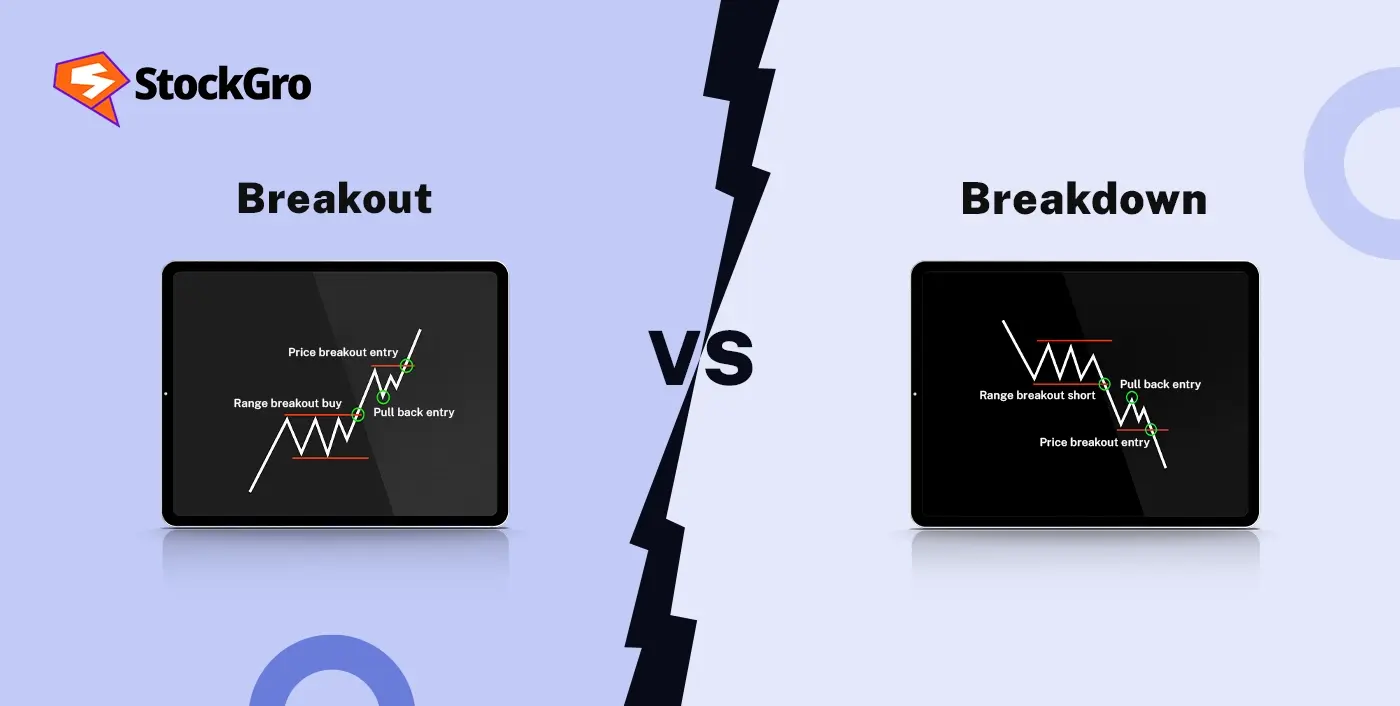
- Catch a bullish breakout by placing a buy stop order right above the high of the mother bar.
- To capture a bearish breakout, set a sell stop order slightly below the low of the mother bar.
- For long positions, the stop loss falls below the mother bar, whereas for short positions, it goes above.
- Confirm the trend or key support/resistance for better trade reliability.
- Avoid trading during choppy or sideways markets.
Best Timeframes for Inside Bar Breakouts
The inside bar candle can show up on any time frame, but the daily chart usually shows setups that are easier to see and more reliable. Shorter timescales typically have an excess of patterns, leading to noise or rapid reversals.
Traders seeking quicker movements can employ the pattern on lower-time frames or those of 15 minutes or less, but they should exercise caution. It is important to let an inside bar complete before taking any action.
Some traders also look at support and resistance levels that are close by or use technical tools before making a move. Inside Bars are easier to read and use for entry and exit on longer timeframes, like daily or weekly.
Indicators to Confirm an Inside Bar Breakout
Using simple indicators can help confirm the breakout move and improve success:
- Moving Averages to confirm trend direction.
- RSI or MACD for momentum confirmation.
- Volume spikes to verify breakout strength.
- Support and resistance levels to validate breakout zones.
Example of an Inside Bar Breakout Trade
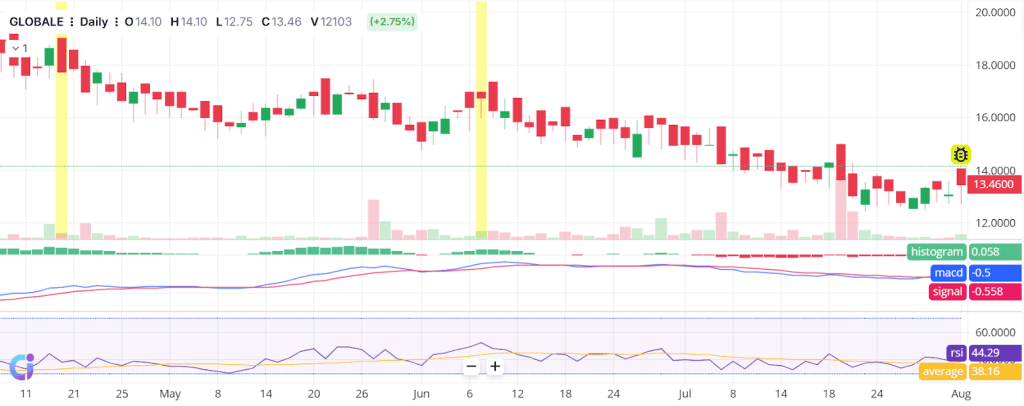
An example of an Inside Bar breakout can be seen on the daily chart of GLOBALE, where a brief pause in price movement is followed by a sharp move. In the middle of June, the price action decreased, creating a classic Inside Bar candle that was entirely within the range of the previous day. This pattern indicated indecision after a few strong candles, suggesting that the market was momentarily consolidating.
The next day, however, the chart shows a decisive red candle breaking below the Inside Bar’s low. This move confirms a bearish breakout, especially when seen in the context of the overall downtrend.
Volume also picks up slightly during this breakout, adding more strength to the move. The MACD continues to trend lower, and the histogram stays negative, a sign that bearish momentum hasn’t faded. The RSI, hovering around 44, reflects weak buying interest.
A careful trader would wait for the candle to close below the Inside Bar before entering short. To mitigate loss, a stop-loss order could be set up immediately above the Mother Bar’s high point. The price continues to slide in the sessions that follow, validating the breakout and rewarding patient traders.
This setup indicates that Inside Bars can give apparent breakout opportunities, especially when they are going in the same direction as the trend and are backed up by volume and momentum indicators.
Common Mistakes to Avoid in Inside Bar Breakout Trading
Even seasoned traders can make avoidable errors when working with Inside Bar setups. A few things to keep in mind are:
- Going Against the Trend: Inside Bars are more dependable when they align with a strong directional move. Using them in flat or sideways markets often leads to false breakouts.
- Taking Every Inside Bar: Not all setups are worth trading. Focus on Inside Bars that form after clear momentum or retracements, and avoid setups that appear in bunches, as these often signal market hesitation.
- Jumping in Too Soon: It’s important to wait until the price breaks beyond the high or low of the Inside Bar before entering a trade. Acting too early can expose you to unnecessary risk if the breakout fails.
- Tight Stop-Loss Traps: Placing stops too close, right around the Mother Bar, can lead to early exits due to normal market noise. Give the trade some room to breathe.
- Ignoring Supporting Signals: Better results often come when Inside Bars appear near strong support/resistance or line up with other technical tools like trendlines or moving averages. A bit of confirmation adds reliability to the setup.
Inside Bar vs. Outside Bar Patterns
| Feature | Inside Bar | Outside Bar |
| Candle Range | Completely inside previous bar | Engulfs previous bar (higher high and lower low) |
| Market Behaviour | Consolidation, pause, low volatility | Strong volatility, momentum shift |
| Trading Signal | Signals potential breakout | Signals strong move or reversal |
| Risk Management | Tight stop loss just outside mother bar | Wider stops due to bigger price swings |
| Typical Use | Trend continuation or reversal trades | Spotting momentum changes or reversals |
| Indication | Market “breathing” before next move | Aggressive buying/selling dominance |
Pros and Cons of Trading Inside Bar Breakouts
| Pros | Cons |
| Clear entry and stop levels make risk management more effortless. | Can give false breakouts, especially on lower timeframes. |
| Works well with trend-following and reversal strategies. | Not reliable in sideways or low volatility markets. |
| Gives early signals of potential big moves. | Requires patience to wait for proper breakout confirmation. |
| Best on daily charts, reducing market noise. | Volume confirmation is needed for stronger signals. |
Conclusion
A classic price action pattern, the inside bar breakout provides traders with a methodical framework for trading breakouts with low risk. The signal is simple, intuitive, and works with additional tools like volume and momentum indicators.
This strategy can work for both intraday settings and daily charts if you manage your risks well and wait for confirmation.
FAQs
An inside bar breakout happens when the price moves sharply above or below a small candle that’s fully inside the range of the previous day. It shows that the quiet phase is over and a new trend might be starting.
To trade it, wait for the price to move beyond the high or low of the inside bar. Enter the trade in that direction. A stop-loss is usually placed just outside the opposite side of the bar to limit risk.
The daily chart is often considered most reliable for inside bar trading. Shorter timeframes, such as the 4-hour or 1-hour, can also be suitable for traders who trade during the day. You should try out different charts to find which ones work best for you.
Volume, RSI, and MACD are all useful. If the volume goes up during the breakout or the momentum indicators point strongly in one direction, it gives you more confidence. These signs help you figure out if the breakout is real or just a fake move.
An inside bar stays between the high and low of the previous candle, which means there is a halt. An outer bar goes above and below the high and low of the last candle. This usually means that the price is moving quickly or that the market is changing suddenly.