Markets rarely reverse without leaving clues. Sometimes a gradual recovery creates the illusion of buyers regaining strength. But under the surface, the momentum is weakening, and sellers are taking control. The inverted cup and handle pattern captures this subtle shift, often appearing before a continuation of the downtrend.
Recognising this pattern helps in identifying potential breakdowns and planning trades accordingly. In this blog, we will understand the inverted cup and handle pattern and how traders interpret it in real market conditions.
What is an Inverted Cup and Handle?
In technical analysis, the inverted cup and handle pattern is used to identify underlying bearish pressure. This pattern is formed during a downtrend and it signals the continuation of the downward momentum.
The pattern resembles an upside-down cup, which is followed by a small handle. Traders monitor this formation as it highlights a period where buyers attempt a recovery but fail to sustain the momentum, allowing sellers to regain control. The Inverted Cup and Handle is an upside-down version of the standard Cup and Handle pattern.
Characteristics of Inverted cup and handle pattern
The key features associated with the inverted cup and handle pattern are:
- Prior Downtrend : This pattern usually forms in a downward trend, indicating continuation of the bearish pressure.
- Rounded Recovery (Cup) : The price rises gradually but starts curving downward, making an inverted cup-like structure.
- Short Consolidation (Handle) : After the cup forms, the price starts moving sideways or slightly upward, forming the handle.
- Breakdown Point : When the price finally breaks below the handle’s support level, it means the pattern is confirmed.
- Volume Behaviour : During the cup formation there is a rise in volume, but when the handle is formed the volume increases adding to the breakdown’s strength.
Importance of inverted cup and handle pattern
The inverted cup and handle pattern holds significance as it helps in interpreting price behaviour and understanding market trends.
- Bearish Signal
The pattern confirms that the bearish momentum will continue, helping traders anticipate the downward price movement. - Trend Confirmation
It acts as a reliable indicator helping traders anticipate potential selling opportunities when bearish momentum continues in the market. - Market Psychology
It represents a transition from buyers to sellers. The cup shows a peak in confidence followed by a decline, while the handle reflects a last failed recovery attempt. - Trading Setup
The inverted cup and handle provides specific entry, stop-loss, and target levels determined by the breakout level’s position from the handle and the cup’s depth.
Example of Inverted Cup and Handle
Let’s understand the pattern with a real-life example of BSE in November-December 2025.
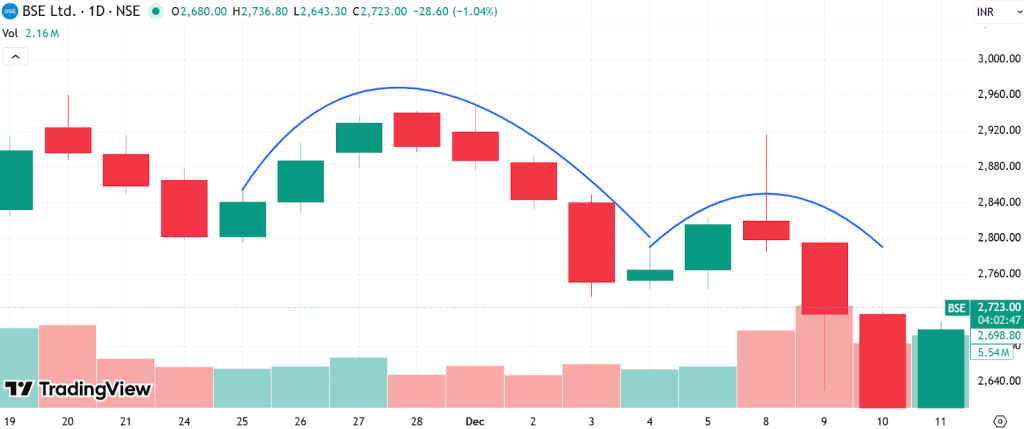
- From November 25 to December 3, the stock rose from around ₹2,800 to ₹2,930. It then curved downward to near ₹2,780, forming the inverted cup.
- Between December 4 and 8, the price had a slight rebound from ₹2,780 to ₹2,830, creating a small upward handle.
- From December 9, 2025, the price continued to fall, reaching around ₹2650, confirming the continuation of the bearish momentum.
Identifying Inverted Cup and Handle Chart Pattern
The inverted cup and handle pattern forms in stages, each reflecting a different market sentiment. Careful observation is required for its identification.
The Cup Phase
The cup phase begins with the price recovering gradually after a decline. Instead of rising sharply, the movement forms a rounded structure as buying interest slowly builds.
However, this recovery lacks strong momentum. As the price climbs higher, buyers get weaker, and the price begins to curve downward again, forming the inverted cup shape.
The Handle Phase
Following the cup formation, the price usually enters a short period of consolidation. The market moves sideways or slightly upward, creating the handle.
This phase represents a temporary pause where the buyers try to push the price upward. Yet the movement remains limited, indicating that sellers may soon regain control.
Recognition and Confirmation
The inverted cup and handle pattern becomes recognisable once both the rounded cup and the handle formation appear clearly on the chart.
When the price breaks below the handle’s support level, it shows the pattern’s completion. The breakdown suggests increasing selling pressure and continuation of the downward trend.
How to Trade the Inverse Cup and Handle
This pattern is interpreted through a series of observations that traders follow to understand how the formation develops and what it may indicate next.
Identification and Confirmation
Begin by recognising the pattern on the price chart. Observe how a gradual recovery forms a cup shape and how the handle appears as a short consolidation phase. When the structure becomes visible, attention shifts toward confirming the trend’s continuation.
For example, imagine a stock called AlphaTech declining from ₹520 to ₹460. The price then rises slowly to ₹500, forming the curved cup shape. After this recovery, the stock moves between ₹495 and ₹505, forming the handle.
Breakout Confirmation
Once the pattern has appeared, the next move is to look for confirmation that will determine whether the trend will hold or not. This confirmation comes when the price drops significantly below a major support level, defining the structure of the pattern.
As an example, the shares of “Beta Pharma” form an inverted cup while the handle’s support sits around ₹210. The shares continue to trade between ₹212-220 for several trading sessions and finally drop to ₹205. This move below the support level signals a confirmed breakdown.
Entry and Exit Points
The inverted cup and handle is also used for determining potential entry and exit zones. These zones are derived from important levels within the pattern. The handle is used for entry, and the target is set with the cup’s depth.
Example: Gamma Motors forms an inverted cup between ₹780 and ₹720. The handle is near ₹730. The price falls below this level to ₹710, signalling a potential entry. The target might be set near ₹660, while placing a stop-loss above ₹735.
Volume Analysis
Volume helps in analysing how strongly a pattern is supported by market participation. Changes in volume can provide clues on whether buyers or sellers are gaining strength during different pattern phases.
For example, an inverted cup appears in Delta Electronics’ stock between ₹350 and ₹320. In the handle phase, the stock trades with a daily volume of around 1.5 lakh shares. When the price drops below ₹315, the volume suddenly rises to 3 lakh shares, indicating stronger selling activity.
Risk Management
Managing the risk is crucial because price movements have unpredictable behaviour. Traders often use protective measures that minimise the losses during unfavourable market movements.
Example: The shares of Omega Steel have an inverted cup close to ₹640, and the handle forms close to ₹625. If the price moves below ₹620, traders should monitor their positions carefully while keeping stop-loss above ₹630 to reduce potential losses.
Technical Indicators
When the chart patterns are combined with technical indicators, it helps in better evaluating the momentum and gauging the trend strength. These indicators improve the pattern’s reliability and lower the chances of false signals.
As an example, suppose there is an inverted cup formation in Nova Green shares at ₹410. While the handle develops around ₹395, the Relative Strength Index (RSI) falls from 55 to 42, indicating weakening momentum.
When the price drops below ₹390, the combined signals strengthen the bearish outlook.
Continuation Patterns
In technical analysis, the inverted cup and handle is categorised as one of the continuation patterns. They appear when the market takes a brief pause before it continues moving in the same direction.
Example: Consider Zenith Logistics, which declines from ₹900 to ₹820. After forming an inverted cup and handle between ₹850 and ₹830, the price breaks below ₹825 and continues falling toward ₹790, reflecting the continuation of the earlier trend.
Advantages of the inverted cup and handle pattern
The benefits of the inverted cup and handle pattern are listed below:
- High Reliability: The patterns show high accuracy when predicting bearish moves, making it a widely used indicator for short-selling strategies.
- Clear Trading Signals: The inverted cup and handle provide actionable signals that traders can use to manage their entries, exits, and adjust their positions.
- Reflects Market Sentiment: The pattern formation reveals weakening momentum over time. It helps in identifying the shift of control from buyers to sellers.
- Works Across Timeframes: The inverted cup and handle can appear on intraday, daily, or weekly charts, making it useful for different trading styles.
- Easy to Combine: It is easy to use the moving averages, volume, RSI, or any other indicators that help in improving its reliability.
Disadvantages of the inverted cup and handle pattern
Despite its usefulness, the inverted cup and handle pattern has certain limitations:
- False Signals: Sometimes the price may briefly move below the handle and then reverse, creating false signals.
- Time-Consuming: It can take weeks or even months for the inverted cup and handle to develop. This makes it unsuitable for short-term trades.
- Subjective Identification: The appearance of the pattern may look different across charts, which can lead to varied and inconsistent interpretations.
- Market Dependency: This pattern’s efficiency is reduced when the market is range-bound or moving sideways.
- Requires Confirmation: Additional indicators, such as volume, MACD, etc., are required to confirm the pattern before entering a trade.
Psychology of the Inverted Cup and Handle
The pattern is a visual representation of the to and fro between buyers and sellers.
Initially, the buyers push the prices upward, creating the round shape. However, as the rally slows down and the resistance holds, buying momentum weakens.
The handle represents a final chance at recovery where buyers attempt another move upward. When this attempt fails, sellers regain control and the downtrend resumes.
Understanding this shift in sentiment helps traders interpret the pattern more effectively.
Conclusion
The inverted cup and handle pattern helps in identifying bearish opportunities. It reflects a failed attempt at price recovery. Combining this pattern with technical indicators and following risk management practices helps in improving trading decisions and outcomes.
FAQ’s
No, the inverted cup and handle is considered a bearish continuation pattern. It usually signals that a downtrend may continue after a brief recovery.
An inverted cup and handle pattern fails when the expected breakdown does not occur. Instead, price moves above the handle, signalling weakening selling pressure.
An upside-down cup and handle refers to the inverted cup and handle pattern, which indicates weakening buying momentum and a possible continuation of a bearish trend.