
If you are an active trader, you need to spot evolving trends proactively without getting misled by random price movements. Most traders use moving averages to analyse price action and trends and to make smart decisions. However, not every moving average works alike. Unlike traditional moving averages, which often lag or overreact, Jurik Moving Average (JMA) stands out because it uses advanced smoothing techniques to give a clearer picture of the trend.
What is the Jurik Moving Average (JMA)?
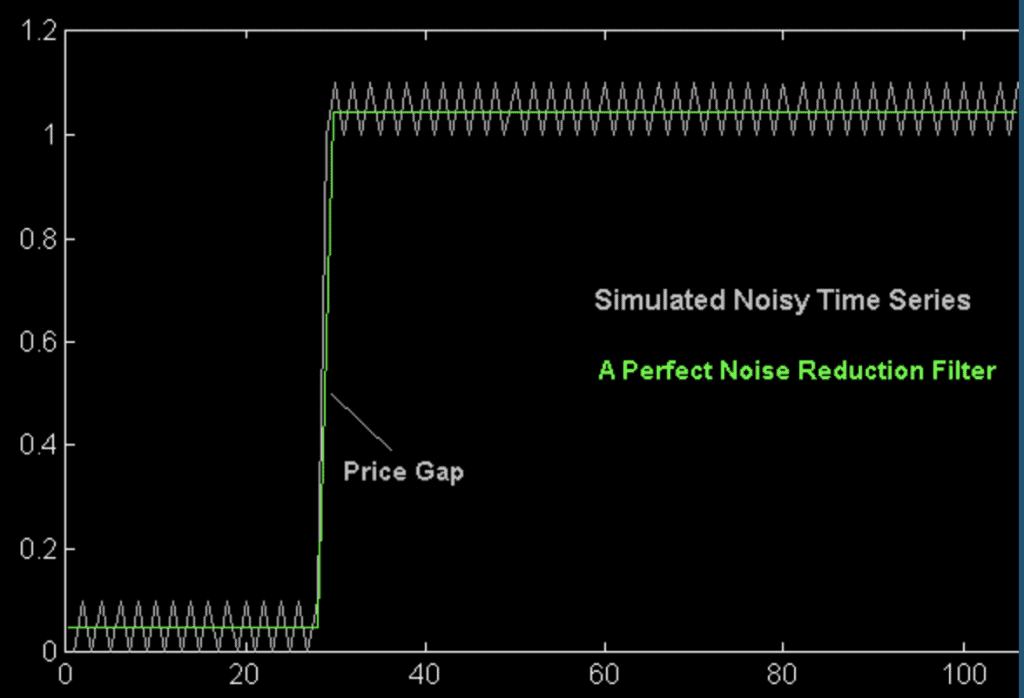
The Jurik Moving Average is a type of technical indicator used to follow the price trend of an asset, like a stock or a currency. What makes it different from regular moving averages is that it tries to reduce the lag or delay in response time while still giving a smooth and clear view of the price trend.
In simple words, the JMA line follows the price more closely and quickly, but without being jumpy. It finds a balance between speed and smoothness. This helps traders make better decisions by showing a cleaner trend.
While the exact formula is not open-source and is only available through licensed Jurik Research tools, traders can still try out versions of JMA through community scripts on platforms like TradingView. These unofficial versions attempt to mimic JMA’s behavior and are useful for those who want to test its advantages before investing in the real thing.
Who Developed the Jurik Moving Average?
JMA was developed by Mark Jurik. He is a mathematician and the founder of Jurik Research. He created this indicator to solve the problem of lag and noise in other moving averages. His goal was to help traders get fast and accurate signals. Jurik Research sells the JMA as a premium tool and is often used by professional and algorithmic traders.
How Does the Jurik Moving Average Work?
JMA uses a specialized algorithm that adapts to market changes. It adjusts based on how quickly the market moves. This makes it effective at following trends and ignoring minor price fluctuations. The exact formula is not public, but the results are clear when viewed on a chart.
Jurik Moving Average vs Other Moving Averages
Here is a brief comparison of JMA with other moving averages.
JMA vs Simple Moving Average (SMA)
SMA calculates a straight average of past prices over a fixed period. It is easy to use but slow to react to changes.
JMA, on the other hand, reacts faster and gives a smoother line. This helps traders identify trend changes more quickly.
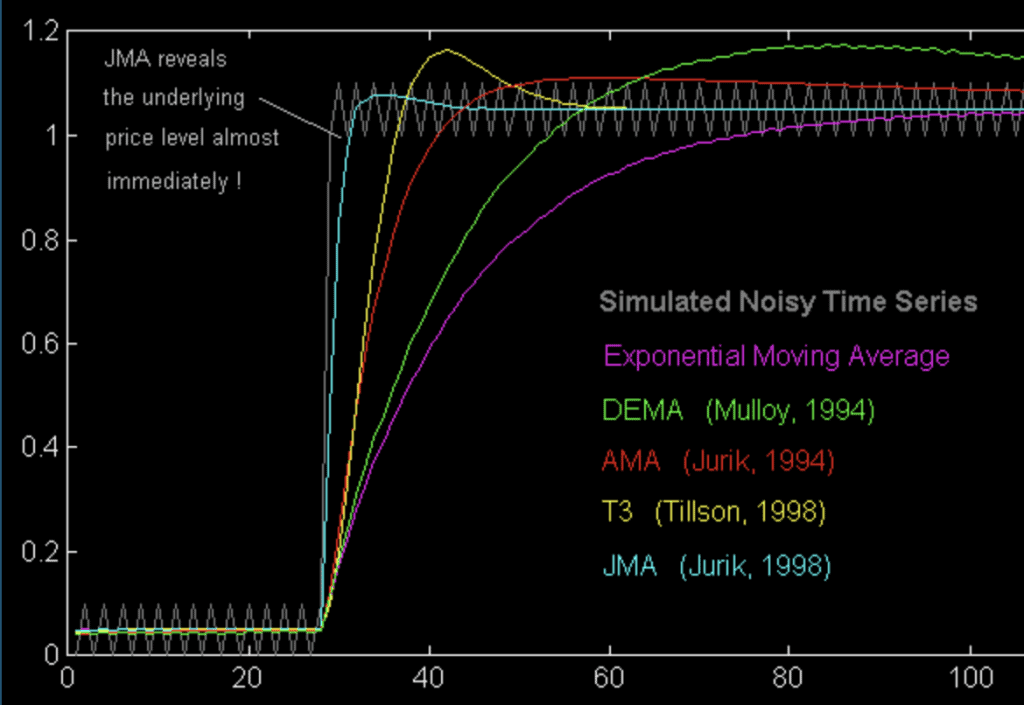
JMA vs Exponential Moving Average (EMA)
EMA takes the average of recent prices. It reacts faster than SMA but can still be noisy.
JMA is better because it adjusts based on market conditions. It gives fast signals without being too jumpy. This makes it easier to trade with confidence.
JMA vs Weighted Moving Average (WMA)
The Weighted Moving Average (WMA) also considers the recent prices more, but it applies a fixed weighting method.
JMA changes its weighting based on how volatile the market is. This gives it an edge in both fast and slow markets. Traders often replace WMA with JMA for better results.
Why Do Traders Use the Jurik Moving Average?
Many traders prefer JMA because it helps them clearly identify the trend. JMA is useful because:
- It removes small, confusing price movements from the chart.
- It responds quickly to changes in direction.
- It works on all types of timeframes, from short-term charts to long-term ones.
- It helps reduce false signals that can lead to bad trades.
In simple terms, traders use JMA because it shows a cleaner and more reliable trend.
How to Use Jurik Moving Average in Trading
Let’s now see how traders use JMA in their daily trading.
Best Timeframes for JMA
You can use JMA on any chart, whether you look at prices every 5 minutes, every hour, or every day. It works well across all timeframes.
- For day trading, traders often use JMA on 5-minute or 15-minute charts.
- For swing trading or long-term analysis, this can be used on daily or weekly charts.
Jurik Moving Average Settings
JMA comes with three main settings:
- Length: This is the number of periods, the average considers. Common lengths are 14, 21, or 50.
- Phase: This controls how fast or smooth the line is. A lower value makes it react faster. A higher value makes it smoother but slower.
- Power: This adjusts the amount of smoothing. Higher values give smoother lines.
These are the common settings for JMA. You can try different settings to consider what works best for your trading strategy.
Combining JMA with Other Indicators
1. JMA with RSI
Combining JMA with the Relative Strength Index (RSI) helps confirm trend direction alongside market conditions. While JMA shows the overall trend, RSI indicates if the asset is in the overbought or oversold area. This helps in avoiding entry at extreme points.
2. JMA with MACD
Using JMA with the MACD (Moving Average Convergence Divergence) adds confirmation to trend signals. JMA gives you a smooth trend line, while MACD shows momentum, strength and direction. Together, they reduce false signals and improve entry timing.
Jurik Moving Average Trading Strategies
Here are a few ways traders use JMA to make trades:
Trend Following with JMA
In a trend-following strategy, trade in the direction of the trend.
- If the price stays above the JMA line for a long time, it usually means the trend is up. Traders may choose to buy.
- If the price stays below the JMA line, it means the trend is down. Traders may choose to sell or avoid buying.
JMA and Moving Average Crossovers
You can use two JMAs with different lengths. For example, use a 10-period JMA and a 50-period JMA.
- Buy Signal: When the 10-JMA crosses above the 50-JMA
- Sell Signal: When the 10-JMA crosses below the 50-JMA.
This crossover method is easy to follow and works well with JMA.
JMA with RSI or MACD
Use JMA to show the trend. Use RSI or MACD to confirm the signal.
- If JMA is rising and RSI is below 30, it may be a good buy.
- If JMA is falling and MACD indicates a sell, it is a signal to sell. This combination gives both trend and momentum information.
Advantages of the Jurik Moving Average
JMA stands out because it solves common problems encountered in traditional moving averages. Some key benefits:
- It provides a clear and smooth overview of the market trend.
- It reacts quickly to changes in price.
- It reduces noise, which helps traders avoid mistakes.
- It works well with other indicators.
- It can be applicable in all timeframes.
Limitations of the Jurik Moving Average
Despite its advantages, JMA isn’t perfect. There are a few loopholes as well:
- It is not free. You usually have to pay for access.
- It may not be available on every trading platform.
- If used alone without confirmation, it can still give false signals.
- The mimic versions available through community scripts may not be reliable.
- It might be too smooth in some situations and miss small but important price moves.
How to Add Jurik Moving Average to Your Charting Software
You won’t find JMA in free tools like TradingView or standard versions of MetaTrader. To use it:
- You may need to buy it from the official Jurik website.
- Find it on Jurik Research: The official provider of JMA for various platforms
- After buying, you can install it on platforms like MetaTrader 4 or 5, or NinjaTrader.
Although you can use JMA on TradingView via community scripts. However, those may not be completely reliable. Always make sure to purchase it from a reliable and secure source.
Related Moving Average Indicators
If you’re looking at other options similar to JMA, here are a few:
- Hull Moving Average (HMA): Known for being both fast and smooth, HMA reduces lag better than standard moving averages. It’s a popular choice for traders who want clearer, quicker signals.
- Adaptive Moving Average (AMA): AMA adjusts its sensitivity based on market volatility, just like JMA. When the market is calm, it slows down; when prices move fast, it reacts more quickly.
Both are useful, but many traders find JMA to be more reliable with higher accuracy over time.
The Jurik Moving Average is a powerful tool for traders who need fast, smooth, and noise-free trend analysis. While it’s not free or widely available, its accuracy and adaptability make it worth exploring, especially when used with other indicators.
FAQs
The Jurik Moving Average (JMA) is best for identifying market trends with minimal lag and noise. It’s especially useful in fast-moving or volatile markets where traditional moving averages may react too slowly or generate false signals. Traders use JMA for cleaner trend analysis, sharper entry and exit points, and more confidence in their technical setups.
Jurik is often considered better than EMA because it reacts quickly to price changes without the choppiness that EMA can create. While EMA gives more weight to recent prices, it can still produce noisy signals. JMA uses an adaptive algorithm that smooths the line while staying responsive, making it a more accurate and visually clearer trend-following tool for many traders.
No indicator is truly lag-free, but JMA comes very close. It’s specifically designed to minimize lag while keeping the signal smooth. Unlike other moving averages that sacrifice either speed or clarity, JMA strikes a strong balance, making it appear almost real-time without the false signals common in faster but noisier indicators like EMA or WMA.
The exact formula for the Jurik Moving Average is proprietary and not publicly available. It’s owned by Jurik Research and is part of their licensed trading tools. What we do know is that JMA uses a nonlinear adaptive smoothing algorithm that adjusts based on market volatility, allowing it to reduce lag while maintaining a smooth and responsive trend line.