In trading, identifying reliable price trends and entry points is a constant challenge. Technical indicators help many traders eliminate market noise and seize opportunities. The first of these tools is the Keltner Channel strategy because of its power in tracking price movement against volatility and accenting strength in the trend.
Whether trading intraday or swing, the Keltner Channel will assist you in identifying breakouts, reversals, and pullbacks in a clear manner. This guide will discuss what it is, how it works, and some useful strategies you can apply.
What is a Keltner Channel?
The Keltner Channel is a volatility-based technical analysis indicator that helps traders to define price trends as well as potential entry and exit points. It is composed of three lines
- Middle Line: Price EMA.
- Upper Channel: EMA + ATR multiple.
- Lower Channel: EMA minus ATR multiple.
Chester W. Keltner originally introduced the concept in the 1960s; however, the ATR is commonly used by traders in place of the underlying high-low range in modern systems because it adapts better.
How Does the Keltner Channel Work?
Keltner Channel strategy adjusts to market volatility. Channel width increases with price volatility and decreases with low volatility.
- Price hugging the top band implies intense purchasing.
- Price touching the lower band signals strong selling pressure.
- Price moving between the middle and outer bands suggests consolidation or weaker momentum.
This makes it useful for identifying trends, potential breakouts, and reversal zones.
Keltner Channel Formula
The standard formula is:
- Middle Line = 20-period EMA of Close Price
- Upper Channel = EMA + (ATR × Multiplier)
- Lower Channel = EMA − (ATR × Multiplier)
How to Trade Using the Keltner Channel
- Identifying Trends
If the price is close to or higher than the upper band, the market is in an upward momentum. When it is equal to or lower than the lower band, then the market is in a downward trend. Direction of the trend is corroborated by the slant of the central EMA line.
- Spotting Breakouts
A breakout happens when the price makes a decisive excursion out of the channel following a duration of consolidation. This may suggest the beginning of a powerful movement in its direction. The traders usually seek confirmation of volume before entering.
- Detecting Reversals
A break of an outer band followed by swift retreat can indicate exhaustion and potential reversal. The confirmation of this can be further made by candlestick patterns, such as pin bars.
Popular Keltner Channel Strategies
Keltner Channel Breakout Strategy
This Keltner Channel strategy focuses on capturing strong moves after a period of low volatility.
- Identify consolidation – Seek a small width of the channel in which the price is trading laterally, that is, one with low volatility..
- Watch for breakout – Wait until a candle closes strongly above the upper band or below the lower band.
- Confirm with indicators – Use volume spikes or a momentum tool like RSI to confirm the breakout’s strength.
- Enter trade – Go long if the breakout is above the upper band, or short if below the lower band. Place your stop loss just inside the channel to limit risk.
Keltner Channel Pullback Strategy
This approach works best in trending markets and aims to enter trades at optimal points within the trend.
- Identify a strong trend – Price should consistently test or hug one of the outer bands, showing directional strength.
- Wait for pullback – Price should retrace toward the central EMA line without breaking the overall trend structure.
- Enter trade – When price resumes moving toward the outer band in the direction of the trend, open your position.
- Set stop loss – Place stops just beyond the opposite outer band to give the trade room while protecting capital.
Keltner Channel vs Bollinger Bands
- Keltner Channels use ATR for volatility measurement, making them smoother and less reactive to sudden price spikes.
- Bollinger Bands use standard deviation, which can cause sharper bollinger band expansions in volatile markets.
Many traders prefer Keltner Channel strategy for clearer, trend-focused signals.
Keltner Channel: Best Settings for Intraday Trading
No “magic” settings that suit all. Your perfect Keltner channel strategy trading parameters will be based on strategy and your timeframe. The following are some of the commonly used points of starting off, according to the varying trading styles:
- Keltner Channel Settings For Day Trading (e.g., 5-min, 15-min charts): The quicker EMA, the smaller multiplier is often preferred. This makes the indicator very sensitive to momentum and volatility surges.
- Keltner Channel Settings for Scalping (e.g., 1-min, 3-min charts):
For ultra-short trades, use a fast EMA (10 or 12-period) with a tight ATR multiplier (1.0–1.5). This setup reacts quickly to small price shifts, ideal for identifying quick breakout or pullback entries. Scalpers look for price touches or breaks outside the channel to capture micro-moves, while the middle EMA acts as a dynamic guide for rapid re-entries and exits. - Swing Trading (e.g., 1-hour, 4-hour charts): It offers a mid-point perspective of the medium-term trend, and it is outstanding in terms of capturing multi-day trends.
- Position Trading (e.g., Daily, Weekly charts): Long-term traders may use a slower exponential moving average to take in the main trend and a broader multiplier to exclude market noise.
Example Chart: Keltner Channel in Action
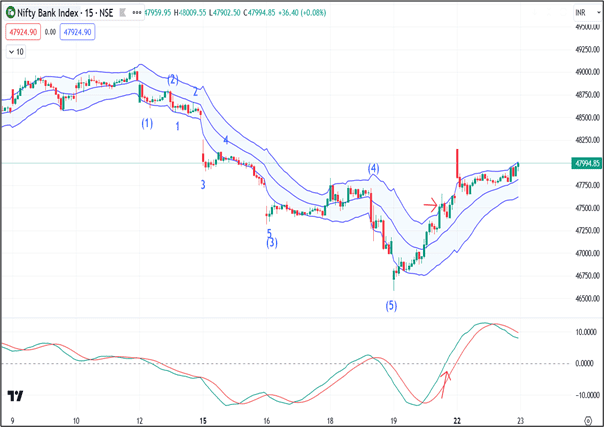
Two important indications that stand out in the Bank Nifty chart are price and momentum. When compared to Bollinger Bands, the Keltner Channel has different uses because it uses the Average True Range (ATR) rather than the standard deviation. The price first surpassed the upper band of the Keltner Channel at 47,500 on April 19th. By crossing above the zero and signal lines, the KST momentum indicator verified this breakout and signalled significant upward momentum. A high of 48,140 was reached on April 22 by Bank Nifty following this setup, an increase of more than 640 points.
Tips to Avoid False Signals
Here’s a slightly more detailed version:
- Always confirm with other indicators like RSI or MACD – Keltner channels are most effective when included in a confluence setup. As an illustration, using them in combination with momentum or trend indicators can filter out any weak or false signals
- Avoid trading during low-liquidity periods – Thin markets are prone to erratic price action and unreliable channel signals, particularly before the market is open or after it closes.
- Watch for price “riding” the band before entering – A steady movement along the outer band may be a sign of a strong trend, but lurching above or below can be dangerous without confirmation by volume or momentum.
- Adjust the ATR multiplier to reduce noise in choppy markets – Narrowing or expanding the channel, depending on volatility, can prevent overtrading in sideways markets.
Pros and Cons of Keltner Channels
Pros:
- Generates smooth, volatility-based signals, reducing market noise compared to many other indicators.
- Performs well in both trending and ranging markets, making it versatile for different conditions.
- Useful for spotting breakouts, pullbacks, and potential reversals with relatively clear visual cues.
- Settings can be easily adapted to suit scalping, intraday, or swing trading timeframes.
Cons:
- Works best when combined with confirmation tools such as RSI, MACD, or volume indicators.
- Less responsive than Bollinger Bands when volatility spikes suddenly, which can delay entries.
- In extremely low-volume markets, price action may create misleading signals.
Related Indicators to Combine
Keltner Channel + RSI
Confirm or deny the overbought or oversold situation using RSI when the price is trading at the extreme bands. As an example, when the price reaches the lower band together with an RSI below 30, the condition may be a buy.
Keltner Channel + EMA
Trades can be filtered by combining with a larger timeframe EMA (e.g. 50 or 200 EMA). Breakout or pullback trades should be only taken in the direction of the higher time frame trend.
Conclusion
The Keltner Channel strategy is a dynamic technical indicator described as a unique combination of both a trend-following indicator and a volatility measuring indicator. Traders can utilize it after setting up its settings and using it in line with other indicators to break out, pull back, or identify reversals. Regardless of whether you make intraday trades or swing trades, learning the Keltner Channel strategy can provide you a systematic way of reading the market momentum and better timing of it.
FAQs
Neither is universally “better”; it depends on trading style. The Keltner Channels employ the average definite range (ATR) in volatility, which further means that it builds smoother bands that are less reactionary to abrupt spikes. Bollinger bands are sensitive to the usage of standard deviation, and therefore, this method is more responsive as well as more erroneous in volatile markets.
The best timeframe depends on your strategy. In line with intraday trading and scalping, traders can use 1-minute, 5-minute, and 15-minute charts when they want to speed up the set-up. The swing trader might want to use bigger charts: daily or 1-hour trends. EMA generally varies by period.
Yes, Keltner Channels can be highly effective for scalping when combined with momentum indicators like RSI or MACD. On lower timeframes, such as 1-minute or 5-minute charts, they help identify breakout entries, quick pullbacks, and micro-trends. Settings like a 10–20 period EMA and 1.5 ATR multiplier are common for faster responses. However, because scalping requires precision, it’s crucial to avoid low-liquidity periods and confirm signals with volume or other tools to reduce false trades.
King Keltner strategy is a rule-based approach of trading strong trends using Keltner Channels and confirmation indicators. The concept is to take trades when the price breaks, and closes above the top channel or below the bottom channel in the direction of the established trend depending upon whether a bullish or bearish trend exists hopefully backed by momentum indicators such as MACD, RSI, or ADX. Traders take profits near the middle line of the EMA, a trailing stop called the middle EMA trailing stop.
Yes — when used with proper risk management and market context. Keltner Channels can be profitable for trend-following and breakout traders, especially when combined with volume or momentum indicators. They work best in markets with clear directional bias rather than choppy, sideways action.
The best timeframe depends on your trading style:
Scalping: 1-min to 3-min charts with fast EMA settings.
Day trading: 5-min to 15-min charts with moderate ATR multipliers.
Swing trading: 1-hour to daily charts for capturing larger trends.
Generally, the 20-EMA base with a 2×ATR band is a balanced setup across timeframes.
Use the middle line (EMA) as a trend guide — price above it signals bullish bias, below it signals bearishness.
Buy when price pulls back to the lower band in an uptrend.
Sell when price touches the upper band in a downtrend.
Combine with confirmation from volume or RSI to improve accuracy.