The chart suddenly flips, momentum shifts, and the price wakes up from its slump: You’re watching a classic market comeback. That’s the moment when a shift in market mood begins to show itself through the MACD bullish crossover.
A MACD bullish crossover appears when the MACD line rises past the signal line, and suggests that the buying pressure is building. The traders use it to catch early trend reversals, spot entry points, and confirm momentum. When it is combined with other indicators, it becomes a more reliable guide for timing smarter trades.
To know more about MACD Bullish Crossover, why it signals trend reversal, and steps to identify it, read this blog!
What is the MACD Indicator?
The MACD, short for Moving Average Convergence Divergence, tracks how two moving averages behave against each other. The traders use the MACD to spot shifts in the price move, which signal when to buy or sell.
Components of MACD (MACD Line, Signal Line, Histogram)
- MACD Line: The MACD line comes from subtracting the 26-day EMA from the 12-day EMA, which shows how strong the price momentum is and which way the trend is heading.
- Signal Line: The signal line is just a smoother 9-day EMA of the MACD line. When the MACD cuts above or below it, the traders treat that move as a potential entry or exit point.
- Histogram: The histogram highlights the distance between the MACD line and the signal line. The rising bars show that the momentum is picking up, while the shrinking bars hint that the trend is losing energy.
What is a MACD Bullish Crossover?
The MACD bullish crossover appears when the MACD line lifts past the signal line, showing that the momentum is turning upward. This change usually signals a growing buying interest and an early push in an uptrend. The traders might treat it as a chance to enter before the trend picks up.
Why a MACD Bullish Crossover Signals Trend Reversal
- Momentum shift: A bullish crossover shows up when the MACD line climbs above the signal line after staying below it, hinting that the upward momentum is gaining speed.
- Uptrend confirmation: When the MACD line moves above its own short-term average, it signals that the price movement is now leading the trend, and is supporting the idea of a strong uptrend.
- Potential buy signal: The traders might read this crossover as a green light to consider long positions because it often appears right as the market starts pushing into an upward phase.
Types of MACD Bullish Crossovers
The MACD bullish crossover type or strength depends on its position compared to the zero line and the current market trend.
Strong Bullish Crossover
| Aspect | Description |
| Location | The crossover below the zero line and then pushes upward through it, giving more room for a strong upside move |
| Trend Alignment | It works better when the overall trend is already bullish and the price stays above long-term moving averages |
| Momentum | The histogram widens consistently after the crossover, showing strong buying pressure |
| Confirmation | Backed by rising volume or support from tools like RSI or key support zones |
Weak Bullish Crossover
| Aspect | Description |
| Location | This takes place above the zero line, often when the market is already overbought or losing steam |
| Trend Alignment | It usually goes against the higher-timeframe trend, making it less dependable |
| Momentum | The histogram barely expands or fades quickly, showing weak momentum |
| Confirmation | It is common where price keeps whipsawing and the signals lack clarity |
Step-by-Step: How to Identify a MACD Bullish Crossover
Step-1 Incorporate the MACD Indicator:
First, add the MACD to the chart using the standard setup. The panel shows the MACD line, the signal line, and the histogram.
Step-2 Locate the Crossover Point:
Next, watch if the MACD line is rising above the signal line, which marks the bullish signal.
Step-3 Confirm Momentum with the Histogram:
After that, check the histogram as it flips from negative to positive. The growing bars confirm stronger momentum, while fading negative bars hint that the crossover is close.
Step-4 Check the Zero Line Position:
Then read the crossovers below zero as signs of a possible trend reversal. The crossovers above zero support an ongoing uptrend.
Step-5 Use Additional Confirmation Tools:
The traders might watch the resistance breaks, RSI levels, and matching signals across timeframes to filter out false moves.
MACD Bullish Crossover Strategy
A MACD bullish crossover strategy focuses on catching the moment momentum shifts in favour of the buyers. When the MACD line pushes above the signal line, it signals that selling pressure is fading and the buyers are starting to take control.
The traders use this shift to time entries during the early phase of an upward move, especially when the price also supports the trend with higher lows, stronger volume, or a break above a resistance level.
Entry, Stop-Loss & Exit Rules
- Entry Rules: The traders might enter when the MACD line moves above the signal line. The setup gets stronger if it also rises past the zero line. They may add confirmation from volume or an RSI above 50. The entries usually happen on the candle close, or after a small pullback for a safer spot.
- Stop-Loss Rules: The traders might place a stop-loss below the recent low or support, or use a trailing stop that follows the price.
- Exit Rules: The traders might exit when the bearish crossover forms or when the histogram starts losing its height. The exits may also take place if the price falls under the moving average or the stop-loss is hit.
Best Timeframes for MACD Bullish Crossover
The best timeframes for MACD bullish crossover depend on the personal goals and trading styles of the traders.
- Position traders: The position traders may stick to weekly or monthly charts since these timeframes help them ride long-term trends with solid stability.
- Swing traders: The swing traders might rely on daily or 4-hour charts to catch multi-day moves with steady momentum.
- Day traders: The day traders might use the 15-minute or 5-minute charts to handle the intraday swings, and pair the MACD with faster settings and confirmation tools.
- Scalpers: The scalpers might prefer to use the 5-minute or 1-minute charts for fast moves, or go for faster MACD settings and tight risk control.
MACD Bullish Crossover + Confirmation Indicators
The MACD bullish crossover can offer a more reliable buy signal when it is confirmed by other indicators that align with upward momentum and trend strength.
MACD + RSI Strategy
The traders use the MACD to identify the trend shifts and the RSI to confirm momentum. When the MACD crosses upward, and the RSI climbs from oversold levels, or for example, stays above 50, both the indicators point towards buyers taking control. It helps the traders to filter fake signals and catch entries where the momentum actually supports the move.
MACD + Moving Average Strategy
The traders pair the MACD crossover with a longer-term moving average to stay aligned with the bigger trend. If the MACD turns bullish while the price trades above an average, for example, the 50-day EMA, it strengthens the case for a long trade. If the price sits below a major average, the traders usually skip the crossover because the wider trend isn’t backing it.
MACD Histogram Rising as Additional Confirmation
The traders watch the histogram flip from negative to positive during the crossover and then check if the bars are continuing to grow. The larger positive bars show momentum is building after the signal, giving extra confidence in the move. If the bars start shrinking, even while positive, it hints that the push upward may be losing steam.
MACD Bullish Crossover with Support & Trendline
A MACD bullish crossover near the support and trendline signals a strong upward momentum. The traders might read this as a clear shift in the market direction because the three confirmations line up all at once.
The MACD shows a rising momentum, the support acts like a price floor, and the breakout signals that the downtrend is losing grip. The traders might enter a trade after a close above the trendline, watch for higher volume, and protect the trade with a stop below the support while targeting the next resistance or using momentum tools to exit.
Common Mistakes While Trading MACD Crossovers
- Relying on MACD alone: The traders might only use the crossovers without confirming them with other indicators, which could lead to false signals and whipsaws.
- Misinterpreting the histogram: The rising histogram indicates strengthening of momentum, but a peak in the histogram can signal that the momentum is fading, suggesting a potential reversal.
- Using default settings blindly: The standard settings may not always be optimal for every market or trading style, and the volatile assets may require different settings compared to the less volatile ones.
Real Chart Example of MACD Bullish Crossover
The chart below shows a MACD bullish crossover:
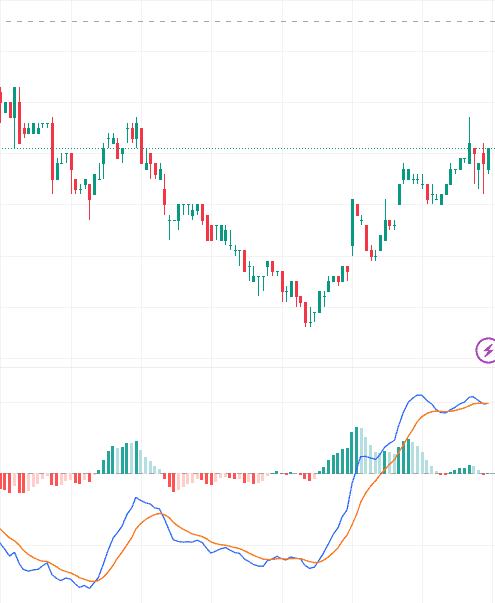
In this daily chart of Tata Power Limited, on 3 December 2025, the blue MACD line lifts above the orange signal line on the right side, just after a sharp dip and bounces around 03:10 PM to 03:15 PM. The histogram also flips to green and expands, which supports the crossover.
Final Takeaway
A MACD bullish crossover hits hardest when the broader trend, support, and momentum all point in the same direction. That’s when the traders treat it as more than a curve on a chart, and it becomes a signal backed by structure and strength. With the confirmation indicators such as volume, RSI, or breakouts, it helps them to catch the moves early and stay on the right side of the momentum.
FAQs
The most accurate MACD bullish signal forms when the MACD crosses above the signal line below the zero line, backed by rising volume, firm support, and a widening histogram, reflecting that the real momentum is returning.
The best timeframe depends on the trader’s style. A position trader might use weekly charts, a swing trader might prefer daily or 4-hour charts, and an intraday trader might rely on 15-minute or 5-minute charts.
Yes, a MACD crossover may hint at a trend reversal when it forms below zero and lines up with support, breakouts, or rising momentum. It only signals a shift, not a guaranteed reversal, by itself.
Yes, the intraday traders can use the MACD crossovers on 15-minute or 5-minute charts, with quicker settings and extra confirmation from volume or RSI to avoid whipsaws.
The MACD alone can lead to false signals. The traders usually pair it with support zones, moving averages, RSI, or volume to filter noise and improve accuracy.