Trading becomes smoother when traders understand what drives the market’s momentum. The tool that quietly shows these momentum flips, which is a signal many intraday and swing traders rely on for early trend clues, is the MACD crossover.
The MACD crossover reflects the moment where the MACD line overtakes the signal line, or vice versa. This shift helps the traders analyse when the strength is gained by the buyers or sellers. Understanding the MACD crossover sharpens entry timing, filters out impulsive trading activity, and offers cleaner confirmation during volatile moves, while adding a practical edge rather than theory to build consistency in the Indian markets.
Read further to know about the MACD crossover, how it works, its types, and strategies.
What is MACD?
The Moving Average Convergence Divergence (MACD) is an indicator which represents the relationship of two moving averages of a stock’s price. It helps in identifying buy and sell signals, trend direction, and strength by analysing the short-term and long-term price trends’ convergence or divergence.
The MACD is built from three moving parts. First is the MACD line itself, which comes from comparing a faster 12-period EMA with a slower 26-period EMA. Then there’s the signal line, a smoother 9-period EMA applied to that MACD line. Finally comes the histogram, the bars that show the gap between the MACD line and the signal line. Those shifting distances give traders a visual read on momentum picking up or fading.
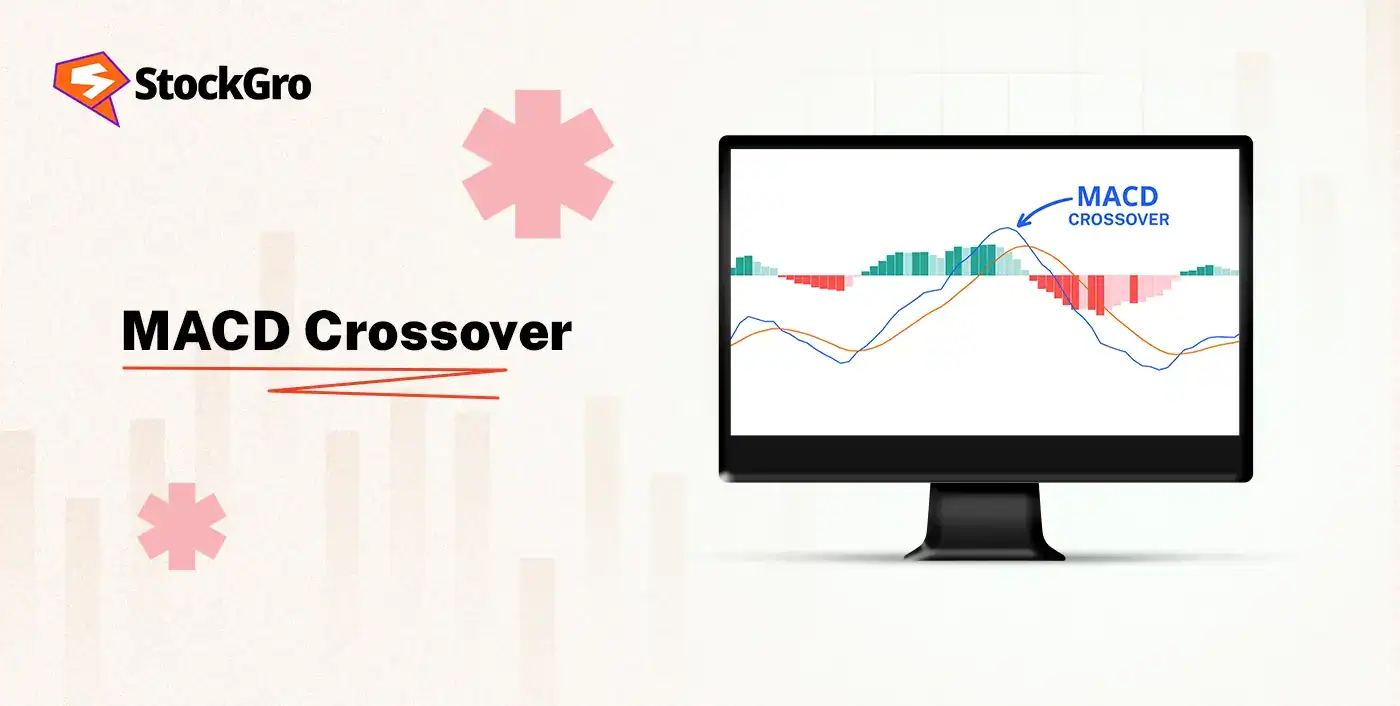
What is a MACD Crossover?
A MACD crossover is a signal, where the MACD line crosses over the signal line. In a bullish crossover, the MACD line crosses over the signal line, suggesting an uptrend. In a bearish crossover, the MACD line crosses under the signal line, indicating a downward trend. These crossovers are used by traders as buy or sell signals to identify potential entry and exit points in a market trend.
How MACD Crossover Works
Let’s see how the MACD crossover works by using the MACD line and the signal line.
- Buy Signals: When the MACD line crosses over the signal line, an increasing upward momentum and a potential buying opportunity are suggested, indicating a bullish crossover.
- Sell Signals: The sell signals usually appear when the MACD line dips beneath the signal line. That downward cross shows momentum shifting to the downside, hinting that sellers may be taking control and that a bearish move could be developing.
How is MACD Calculated? (12-26-9 Formula Explained)
Let’s check out the MACD calculation by breaking down the 12-26-9 formula:
| Steps | Process | Formula |
| Step 1: Calculate the EMAs | – | 12-period and 26-period EMAs of the closing price |
| Step 2: Calculate the MACD Line | MACD = (12-period EMA − 26-period EMA) | It is the difference between the short-term and the long-term momentum, oscillating around the zero line |
| Step 3: Calculate the Single line | Signal Line = 9-Period EMA of the MACD Line | A smoothened EMA of the MACD line is used to identify crossovers |
| Step 4: Calculate the MACD Histogram | MACD Histogram = MACD Line − Signal Line | It is a visual representation of the momentum strength and potential crossover shifts |
Types of MACD Crossovers
The types of MACD crossovers and the signals are based on the relationship between the MACD line and the signal line.
✅ Bullish MACD Crossover (Buy Signal Example)
In a bullish MACD crossover, the MACD line rises above the signal line after approaching it from below. That shift shows the shorter-term trend has overtaken the longer-term trend, signaling strengthening upward momentum. Traders often read this as a sign that buying pressure is building.
A bullish zero-line crossover, where the MACD line crosses above zero, might further confirm the uptrend and strengthen the signal.
✅ Bearish MACD Crossover (Sell Signal Example)
In a bearish MACD crossover, the MACD line dips under the signal line, showing that the short-term trend has slipped below the longer-term trend. That shift reflects growing downside momentum, which traders often treat as an early heads-up for a possible selling opportunity.
A bearish zero-line crossover, where the MACD line crosses below zero, might further confirm the downtrend.
MACD Strategy for Intraday Traders (India Market)
The MACD strategies are usually used in combination with other indicators like the Relative Strength Index (RSI) and Exponential Moving Averages (EMAs) in order to confirm signals and reduce false triggers.
MACD + RSI Confirmation Strategy
The MACD + RSI confirmation setup blends momentum and the strength of the trend to filter cleaner entries. A buy setup forms when the RSI lifts from oversold or holds support, and the MACD gives a bullish crossover with a positive histogram, and a sell triggers when the RSI drops from overbought and the MACD turns negative.
The traders might enter only after both signals align, while they set a stop below the recent swing low, and exit when the MACD reverses or the RSI nears overbought.
MACD + EMA Trend Strategy (Squad strategy)
The MACD + EMA Trend Strategy blends the trend direction with the momentum to filter out cleaner trades. The long-term EMAs define if the market is experiencing an uptrend or a downtrend, and the MACD crossovers provide the entry trigger. A bullish trade might be taken when the price stays above the EMAs and the MACD turns positive, while a bearish trade forms when the price stays below the EMAs and the MACD turns negative.
The positions are managed by holding as long as the trend remains intact and exiting on the opposite side of the MACD crossovers.
Best MACD Settings (12-26-9 – why traders use it)
| Trading style | MACD Settings | Why do traders use it? |
| Scalper | 3-10-16 | These are faster settings which are highly responsive to quick price changes, and is ideal for catching rapid momentum shifts in volatile markets |
| Intraday | 5-35-5 | These settings provide a balance between speed and reliability, with fewer false signals than the ultra-fast settings, while still quick enough for intraday actions |
| Swing | 12-26-9 | These are the classic settings, which are well-suited for capturing the multi-day to multi-week trends and filtering out minor fluctuations, catches new trends earlier |
MACD Signal Filtering (Avoid False Signals)
- Using multiple time frames: The traders might check the MACD on higher and lower time frames to confirm the trend direction and time entries. They may take trades only when all frames align, while avoiding setups with conflicting signals.
- Combining with other indicators: The traders might validate the MACD crossovers with the EMA direction, rising volume, or RSI momentum, and may enter only when the crossover aligns with trend, strong volume, and supportive RSI conditions.
- Using chart patterns and price action: The traders might watch for crossovers or divergence near the support, resistance, or trendline breaks, and may act only when the MACD momentum aligns with the key price levels, improving reversal or continuation accuracy.
- Using built-in filters: The traders might rely on the MACD histogram strength or custom filters to skip weak signals. They may enter only when momentum shows a clear expansion, reducing false trades in sideways or choppy markets.
MACD Backtesting Checklist (India Stocks / NIFTY)
- Strategy Definition: The traders might start by setting clear rules for entries and exits using MACD crossovers, zero-line signals, or divergence. A clear structure would improve consistency during the backtest.
- Data & Tools: The traders might pick a backtesting platform such as Streak or TradingView, or stock market AI tools, like Stoxo, and gather historical data for NIFTY or individual stocks. The long, accurate datasets help in avoiding misleading results and make the final backtest more dependable for real market conditions.
- Backtest Execution: The traders might program the rules into the platform and run the strategy across different market phases to check stability, including brokerage costs, taxes, and slippage, so that the results match real-life trading instead of giving inflated or unrealistic performance.
- Performance Analysis & Validation: The traders might study metrics such as net profit, win rate, drawdown, and profit factor, then compare results with buy-and-hold. They avoid overfitting and refine the rules until the strategy stays steady across changing market conditions rather than working only on past data.
When NOT to use MACD (Sideways Market Warning)
In a sideways market, the price oscillates between the support and resistance levels, without establishing any clear momentum in either direction, and the MACD struggles in these conditions:
- False Crossovers: The MACD line and signal line cross over one another frequently as the momentum shifts back and forth, which might lead to a number of false buy and sell signals.
- Whipsaws: If the traders act on these false signals, it could lead to whipsaws, where a trader enters a position just before the price quickly reverses, resulting in a series of losing trades.
- Drifting Near Zero Line: The MACD value tends to float around the zero line in the range-bound conditions because the short-term and long-term moving averages remain close to each other, which makes the zero-line crossovers ineffective as trend filters.
- Lagging Nature: As a lagging indicator based on historical prices, the MACD is slow to react to the rapid, short-lived price changes, especially in a choppy market. This often gives signals after a price move has already occurred or reversed.
MACD vs RSI vs EMA – Which is better?
The MACD, RSI and EMA all work better when they are combined. Now, let’s see how they are different from one another.
| Aspect | MACD | RSI | EMA |
| Function | It confirms direction, strength, and momentum of the trend. | It identifies the overbought and oversold conditions and reversals | It is a measure of price trend, offering simple visual confirmation of the direction |
| Market | It excels in strong, trending markets | It works the best in range-bound or sideways markets | It is effective in both trending and volatile markets |
| Signal Type | The traders might react to the crossovers of the MACD line and signal line, and zero-line crossovers | The traders might react to the crossovers of key levels and divergences from price action | The traders might react to the crossovers of different period EMAs or price crossing an EMA |
| Lag/Speed | It is slower as its calculation is based on moving averages, and it considered a lagging indicator | It is faster, provides early signals of reversals, and it is considered more leading for reversals | Here, the period determines the lag, the shorter periods respond faster to price changes |
Common Mistakes Traders Should Avoid
- Relying solely on MACD: The traders might use the MACD in isolation, which can generate false signals. It must be used by combining with other technical indicators and price action to confirm signals.
- Ignoring timeframes: A MACD crossover on a short-term chart, for example, a 1-hour chart, can conflict with the trend on a longer-term chart, like a daily chart, leading to poor decisions. Therefore, checking the trend is important across multiple timeframes.
- Ignoring the overall trend: If the MACD crossover is used against the prevailing trend, it might be a mistake. A bearish crossover in a strong uptrend, or a bullish one in a strong downtrend, is less reliable and can be a sign of a temporary reversal.
- Misinterpreting the histogram: A rising histogram indicates strengthening of a momentum, but a peak in the histogram may signal that momentum is already waning and a reversal is near, and it might not be a good time to enter a new long position.
Conclusion
The MACD crossover helps traders in reading momentum shifts, planning entries with more confidence, and avoiding impulsive trades during volatile moves. When it is combined with the RSI, EMAs, price action, and proper filtering, it becomes a practical tool, especially for intraday and swing setups. Additionally, the clear rules, backtesting, and trend alignment help the traders use the MACD crossovers with discipline in the Indian markets.
FAQ’s – MACD crossover
A MACD crossover is a signal generated when the MACD line, 12-period EMA minus 29-period EMA, crosses the signal line, 9-period EMA of the MACD line. These crossovers are used by traders as buy or sell signals to identify potential entry and exit points in a market trend.
The bullish MACD crossover is when the MACD line crosses over the signal line from below, indicating that the short-term moving average is now above the long-term moving average, and momentum is increasing. It is usually interpreted as a buying opportunity.
When the traders combine MACD with trend direction, RSI, EMAs, and volume, using it alone may create false signals, especially in choppy or sideways markets.
The intraday traders might use the 5-35-5 setting, because it balances speed and reliability, offering quicker signals than classic settings while avoiding excessive noise.
The MACD tracks trend and momentum, while the RSI highlights the overbought or oversold zones. They both work best when used together to confirm signals and reduce false triggers.
While using TradingView, the traders wait for a bullish or bearish crossover, check trend direction using EMAs or RSI, confirm momentum with the histogram, and place trades only when everything aligns.
The best timeframe for MACD crossover depends on the trading style. The intraday traders might use 5–15 minute or hourly charts, while swing traders might prefer 4-hour or daily charts for stronger signals.
The bearish MACD crossover is when the MACD line crosses below the signal line, which suggests that the short-term moving average has moved below the long-term moving average, and the downside momentum is increasing. It points to a potential sell signal.