Trading feels far more manageable for the traders when they are able to read the shifts in market strength early. The tool that quietly exposes moments when momentum disagrees with price, hinting that a reversal may occur even before price reacts, is the MACD divergence.
MACD divergence is a condition where the MACD moves opposite to the price of an asset, while suggesting a potential trend reversal. This mismatch helps the traders to see whether the buyers or sellers are losing control. Understanding MACD divergence helps traders, especially in the Indian markets, who want more dependable setups, and mastering it will provide a practical, actionable edge.
This blog offers an overview of MACD divergence, its types, MACD divergence vs RSI divergence, and much more.
What is MACD divergence?
The MACD divergence is a condition which helps traders where the MACD moves in opposite direction of an asset’s price, suggesting a potential trend reversal. It usually happens when the asset’s price makes a higher high but the MACD makes a lower high, in case of bearish divergence, or when the price goes for a lower low while the MACD goes for a higher low, in case of bullish divergence.
MACD refresher (12-26-9, signal line, histogram)
Moving Average Convergence Divergence (MACD) tracks how a stock’s short-term and long-term prices move in relation to each other. The traders use it to measure momentum, spot trend shifts, and time entries or exits by studying how these two averages come together or pull apart.
It comprises three elements of MACD that work together: the MACD line, signal line, and the histogram.
- The MACD line shows the difference between the 12-period and 26-period EMAs, giving a direct read on short-term vs long-term momentum.
- The 9-period EMA of the MACD line is the signal line, which smoothens the momentum so the crossovers become easier to spot.
- The histogram turns their relationship into bars, positive when the MACD is above the signal line, and negative when it’s below, which lets the traders see momentum shifts as the bars expand or shrink.
What is divergence in trading? (price vs momentum)
Divergence in trading is a concept where the price of an asset moves in an uptrend or downtrend direction while a technical indicator moves in the opposite direction, suggesting a trend reversal or weakening momentum.
This occurs because the indicator fails to confirm the price action, signaling a possible loss of strength in the current trend.
In bullish divergence, a lower low is established by the price, but the momentum indicator establishes a higher low. In bearish divergence, the indicator’s lower high contrasts with the price reaching a higher high.
Types of MACD divergence
Let’s discuss the types of MACD divergence!
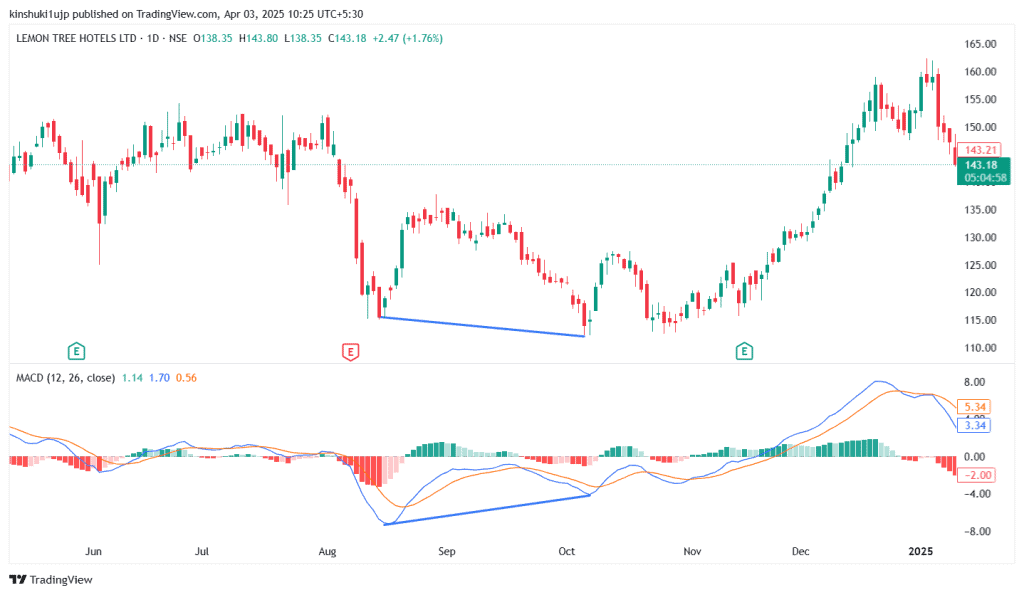
Bullish divergence (with chart example)
In regular bullish divergence, the price establishes a lower low, while the MACD reaches a higher low, indicating that the downward momentum is growing weak, even as prices fall.
For example, this chart of Lemon Tree Hotels Limited shows a bullish divergence that played out strongly. The price slipped into a lower low around September 2024, but the MACD refused to follow and printed a higher low, signaling that downward momentum was losing steam.
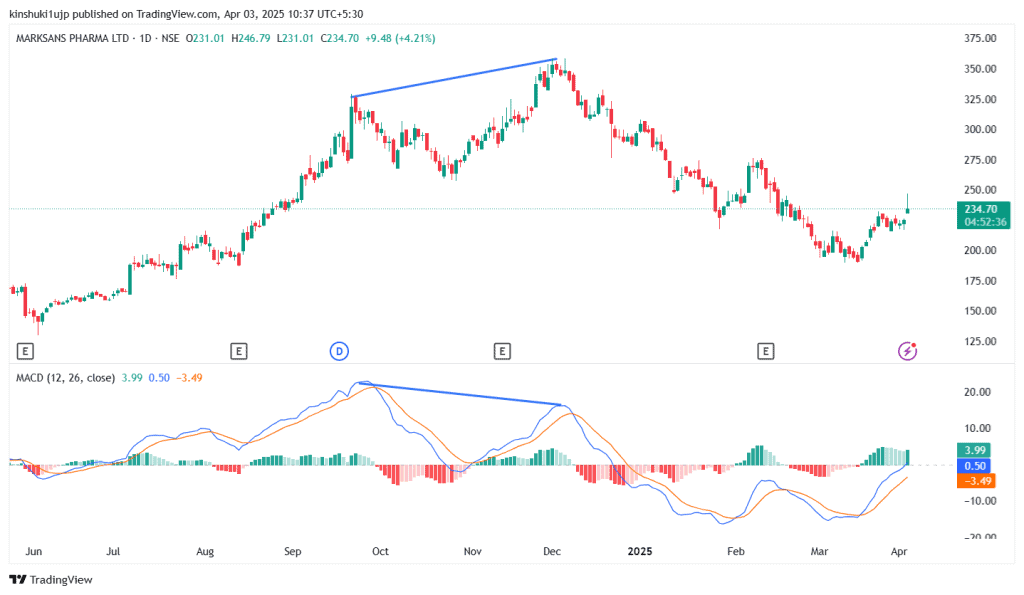
Bearish divergence (with chart example)
The regular bearish divergence suggests a potential trend reversal to the downside, where the price makes a higher high but the MACD reaches a lower high.
For example, this chart of Marksans Pharma Limited shows a bearish MACD divergence, where the price made a higher high in late October-November, but the MACD made a lower high, signalling fading buying strength. Once momentum rolled over, the stock shifted into a downtrend, confirming that the rally had already weakened underneath the surface.
Hidden bullish & hidden bearish divergence
Hidden bullish divergence shows trend strength during a pullback, where the price makes higher lows while MACD makes lower lows, and hidden bearish divergence shows trend strength during a bounce in a downtrend, where the price makes lower highs while MACD makes higher highs.
Altogether, they signal trend continuation, the bullish divergence reinforces ongoing uptrends, and bearish divergence reinforces ongoing downtrends, even when the momentum briefly contradicts price.
Timeframes & markets (intraday vs swing in India)
In case of intraday or day trading, the traders might prefer a shorter timeframe, for example, 5-minute, 15-minute, or 1-hour charts, and a faster setting, for example, 5-35-5, which can generate quick signals to grab short-term movements. Here, the traders could look for faster momentum shifts, which are indicated by divergences on short-term charts, to make quicker entry or exit decisions.
In swing trading, the traders might prefer a longer timeframe compared to day trading, for example, daily or 4-hour charts for identifying trends, or 1-hour charts to spot precise entry points. For the MACD settings, they might utilise the default settings of 12, 26, 9, or might go slower with settings like 20, 40, 10 to filter out noise and focus on larger trends. The swing traders here can identify potential trend reversals indicated by divergences over a longer period, holding positions for a few days to a few weeks.
How to spot MACD divergence step-by-step (TradingView)
Step 1: Add the MACD Indicator to the Chart
First, open the desired chart on TradingView, and click on the Indicators button at the screen top, and type MACD in the search bar. Then, select Moving Average Convergence Divergence, the built-in version under Technicals, to add it to the chart. It usually appears in a separate panel below the price chart.
Step 2: Identify Potential Price Pivots
Next, the traders need to look for significant peaks or highs in an uptrend or troughs or lows in a downtrend on the main price chart. These points serve as a basis for comparison.
Step 3: Compare Price Pivots with the MACD Indicator
After that, the traders need to compare the trendlines while connecting the pivots on the price chart with the corresponding pivots on the MACD lines or histogram.
- In case of bullish divergence, the price would make a lower low, where the second trough is lower than the first, while the MACD forms a higher low, where the second trough is higher than the first.
- In case of bearish divergence, the price would make a higher high, where the second peak is higher than the first, while the MACD forms a lower high, where the second peak is lower than the first.
Step 4: Use Drawing Tools to Confirm
It is suggested that traders should use the Trendline tool on TradingView, although it is not compulsory, to visually connect the two peaks on the price chart. Then, draw the corresponding trendlines on the MACD panel to confirm that the slopes are actually moving in the opposite directions.
Step 5: Confirmation from Other Indicators
The divergences are more reliable when they are confirmed by other signals and avoid false positives.
Confirmation rules: price action, RSI, volume
The traders might use price action, RSI, and volume to confirm MACD divergence.
- Price Action Strategy: The traders might wait for a strong reversal candlestick pattern, such as a hammer, engulfing setup, or shooting star, or watch for a break of the support or resistance level that aligns with the expected reversal.
- Relative Strength Index (RSI): The traders should confirm the momentum shift by checking whether RSI also shows divergence, where the price and RSI form opposite highs or lows, or by observing when RSI exits extreme zones.
- Volume: The traders may look for rising volume as the price starts to move in a new direction, or unusually low volume during the final extreme of the previous trend, which hints that the existing trend is losing conviction.
MACD divergence vs RSI divergence
| Aspect | MACD Divergence | RSI Divergence |
| Focus | It tracks two Exponential Moving Averages (EMAs) to identify changes in trend strength and direction. | It quantifies the rate and magnitude of price fluctuations, identifying whether an asset is experiencing overbought or oversold situations. |
| Market | It performs better in trending markets, and confirms the strength and potential shifts within an existing trend. | It works better in range-bound or sideways markets, where it effectively identifies potential turning points at price extremes. |
| Signal timing | The MACD tends to lag price movements, and provides more confirmation of a trend shift once it is underway, potentially missing the optimal entry or exit points. | The RSI tends to provide signals earlier, which can be an advantage but, it may also result in more false signals during strong trends. |
Bottom line
The MACD divergence helps traders in catching shifts in momentum before the price fully reacts. It enables comparison between the price swings with the MACD swings, which helps the traders to spot both reversals and trend continuations beforehand.
When combined with confirmation tools such as RSI, volume, and clear candlestick signals, it becomes a practical tool for filtering noise and timing trades better across short-term trading setups.
FAQ‘s
The MACD divergence is a condition where the MACD moves in the opposite direction of the asset’s price, while suggesting a potential trend reversal. It occurs when the asset’s price makes a higher high and the MACD makes a lower high, or when the price makes a lower low and the MACD makes a higher low.
The MACD divergence highlights the moments when the momentum disagrees with the price, suggesting the trend is weakening. This mismatch can warn of an early reversal or confirm a trend continuation during pullbacks or bounces.
The regular divergence is stronger for spotting reversals, while hidden divergence is better for confirming trend continuation. The regular signals direction change, and the hidden confirms trend strength.
Yes, the intraday traders can use divergences on, say, 5-minute, 15-minute, or 1-hour charts. The faster MACD settings help them in catching quick momentum shifts, which makes it useful for short-term entries and exits.
The reliability of the MACD divergence improves when it is combined with RSI, volume, and price action signals like breakouts or reversal candles, helping avoid false setups.
The MACD divergence works well in trending markets as it reflects strength within the trend. The RSI divergence is better in range-bound markets by revealing overbought or oversold extremes. The MACD confirms trends, while the RSI spots early shifts.