When a chart keeps closing near the same lower level despite heavy selling, it becomes difficult to read whether the pressure is easing or still pushing the price downward. The matching low candlestick pattern helps understand this exact situation by showing two candles that settle at almost identical closing prices after a decline. In this guide, you’ll learn how the pattern forms, what its repeated close reveals on the chart, and how it fits into broader candlestick analysis.
What is the Matching Low Pattern?
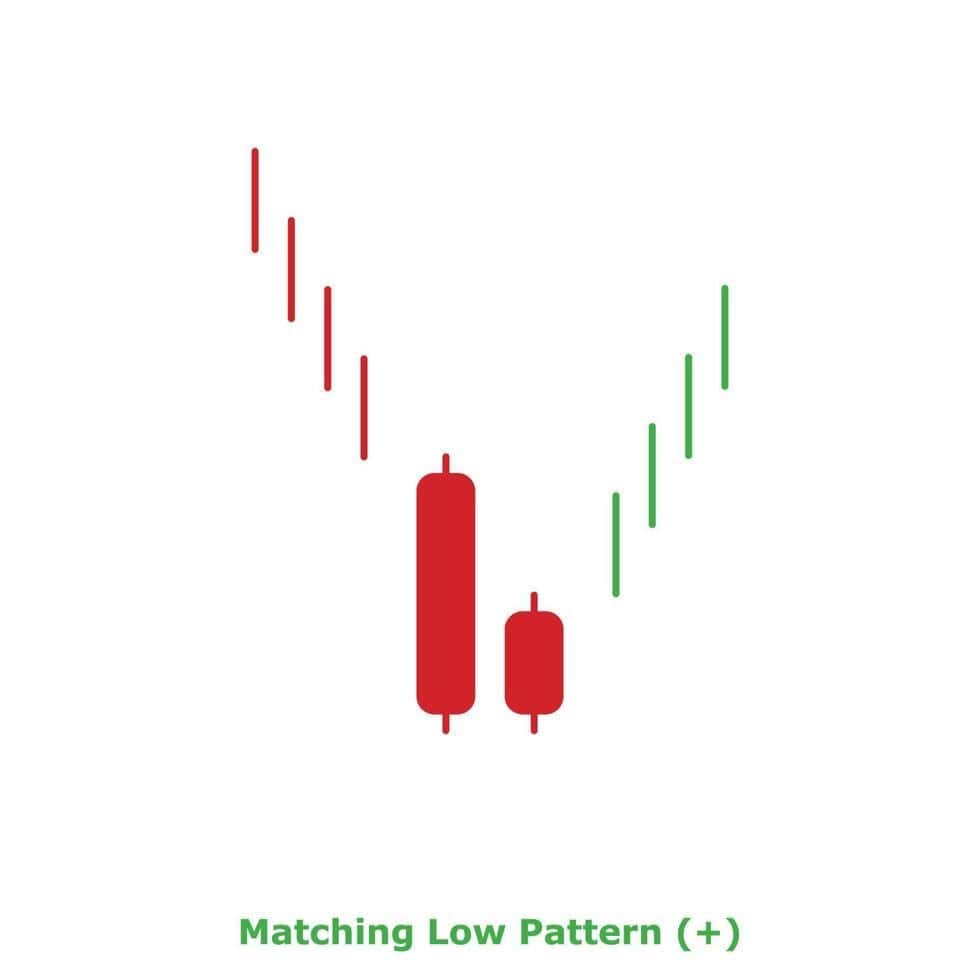
The matching low is a two-candle structure seen in a downtrend and is one of the less frequently observed candlestick reversal patterns. It consists of two bearish candles with identical or nearly identical closing prices. This alignment points to weakening selling pressure and highlights a possible support level forming. While it can point toward a bullish reversal, the pattern is rare and typically calls for confirmation.
How to Identify a Matching Low – Step-by-Step
To find a matching low candlestick pattern on a price chart, you can look for the following features:
- Confirm the trend: The pattern must appear during an existing, clear downtrend in price.
- First candle: The first candle must be a bearish candle (red or black), showing that the price moved down and continued the trend. This candle is often medium to large in size.
- Second candle: The second candle must also be a bearish candle. It might open slightly higher than the first candle’s close, but it then moves down during the session.
- Matching closes: This is the most important rule. The second candle’s closing price must be identical, or almost identical, to the closing price of the first candle. This creates a clear horizontal line of support.
- Location (optional): The pattern is often considered more reliable if it forms at a known support level on the chart (such as a previous low).
- Shadows: In a “classic” Matching Low, neither candle has a lower shadow (or wick). However, in practice, many analysts accept patterns with small lower shadows, as long as the two closing prices match.
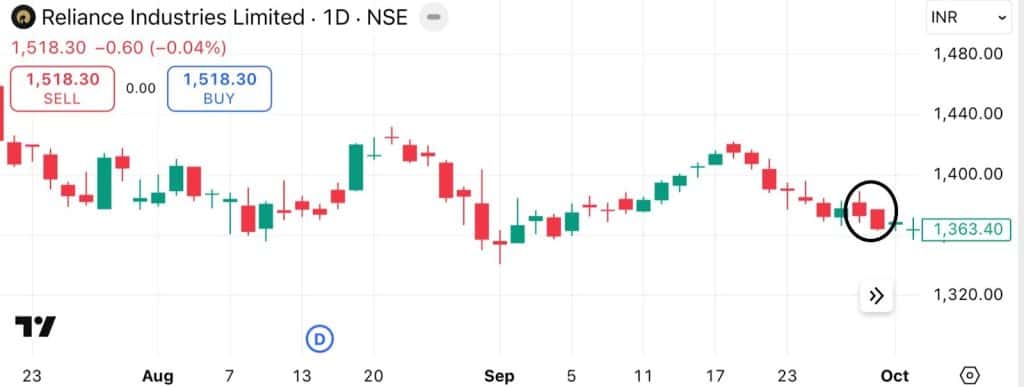
Here is a real-chart example of the matching low candlestick pattern, taken from a 1-day chart of Reliance Industries. As you can see in the circled area, the pattern (formed on September 26 and 27) appears during a clear downtrend. The two consecutive red candles close at the exact same price, perfectly demonstrating the horizontal support level that defines this pattern.
Structure & Appearance of the Matching Low
The matching low candlestick pattern is a two-candle setup appearing in a downtrend. It is defined by its two bearish (red or black) candles that have identical, or nearly identical, closing prices, forming a short-term support level.
- Time-frames: daily, intraday, weekly
The pattern can appear on any chart time-frame, which include:
- Daily, weekly: When found on high time-frames like daily or weekly charts, the pattern is often seen as more significant. It represents a stronger, more definite level of support because it is held over a longer period.
- Intraday: The pattern can also be found on shorter-term charts (like 1-hour or 15-minute). However, it may be less reliable on these time-frames and could lead to more “false signals” due to normal market noise.
- Confirmation signals (volume, support, indicators)
The Matching Low pattern by itself is not a complete trading signal and should be validated by other market data. To increase reliability, traders look for confirmation signals, as follows:
- Support: The pattern is considered significantly stronger when it forms at a known technical support level. This could be a previous swing low, a horizontal support line, or a demand zone.
- Confirmation candle: A common confirmation is waiting for the third candle. If this candle is bullish (green or white) and closes above the pattern, it helps confirm that buyers are taking control.
- Volume: Trading volume can provide clues. Very low volume during the pattern’s formation might make the signal unreliable.
- Indicators: Other technical indicators are often used to validate the signal and avoid false positives.
- Using Matching Low with volume, RSI, MACD
To strengthen the analysis, the Matching Low pattern can be combined with specific indicators, such as:
- Volume: Traders look for declining volume during the downtrend, followed by a potential volume expansion on the second candle of the pattern or the subsequent confirmation candle. A higher volume on the second candle suggests genuine buying interest is emerging at that price.
- RSI (relative strength index): A bullish signal is considered stronger if the RSI, a momentum oscillator, is rising from an oversold region (e.g., below 30) as the Matching Low pattern forms. Bullish divergence, where the price hits a new low but the RSI makes a higher low, also strengthens the signal.
- MACD (moving average convergence divergence): This indicator can be used to confirm a change in momentum. A bullish crossover (where the MACD line crosses above the signal line) happening around the same time as the pattern supports the case for a bullish reversal.
Matching Low vs Other Patterns
The matching low candlestick pattern becomes easier to recognise when compared with similar two-candle formations, as shown below.
Matching Low vs Tweezer Bottom / Matching High
Since these patterns often look alike on charts, a closer breakdown between tweezer bottom, matching high and matching low helps showcase what truly sets them apart, as follows:
| Feature | Matching low | Tweezer bottom | Matching high |
| Candle structure | Two consecutive bearish candles that close at almost the same price level | Two candles (any mix of bullish/bearish) that form identical or nearly identical lows | Two consecutive bullish candles that close at almost the same upper price level |
| Primary signal basis | Consistency in closing prices near the lower range | Consistency in wick lows showing price touching the same bottom | Consistency in closing prices near the upper range |
| Candle colour | Generally two red candles showing continued downward movement but stable close | Can be a mix—one red and one green, two reds, or two greens | Generally two green candles showing sustained upward movement but stable close |
| Wick importance | Wick size is not the main factor; the matching close defines the pattern | Wick lows are the main focus, as both candles share the same bottom | Wick size is secondary; the matching close at the top defines the pattern |
| Visual appearance | Both candles show similar closing levels with bodies positioned near the lower end | Both candles show nearly equal lower shadows regardless of body size or colour | Both candles show similar closing levels with bodies positioned near the upper end |
| Formation zone | Appears after a downward move when prices close repeatedly at the same lower level | Appears after a downward move when prices test the same low twice | Appears after an upward move when prices close repeatedly at the same higher level |
| Pattern focus | Highlights stability in closing levels at the bottom | Highlights repeated testing of the same low | Highlights stability in closing levels at the top |
| Opposite pattern | Matching High | — | Matching Low |
How to Trade the Matching Low Pattern (Practical Strategy)
Using the matching low candlestick pattern in a trading strategy involves creating a clear, rules-based plan. This plan defines exactly how to enter a trade, how to manage risk, and when to take profits. A practical strategy includes the following:
- Entry rules
The Matching Low pattern itself is a warning sign that the downtrend is weakening, not a direct signal to buy immediately. Acting on the pattern without proof that buyers are in control can be risky, as the price could just be pausing before falling further. For this reason, most strategies rely on confirmation.
- Wait for the third candle: The most common form of confirmation is to wait for the candle that forms after the two-candle pattern.
- Bullish confirmation: This third candle should be a bullish candle (green or white), indicating that buyers have started to push the price up from the support level created by the matching closes. A strong confirmation candle might be a “marubozu” (a candle with no wicks) or any candle with a large body that closes near its high.
- Confirmation close: A more reliable entry signal occurs if this third candle closes above the high price of the two-candle pattern. This shows that buyers have not only absorbed all the selling pressure at the low but have also successfully broken above the pattern’s immediate resistance.
- Placing the entry: Based on this, an entry order might be placed just above the high of that third confirmation candle, ensuring the trade is only entered if the new upward momentum continues.
- Stop-loss, target setting & trade management
This part of the strategy defines the exit plan, covering both a losing trade (risk management) and a winning trade (profit target).
- Stop-loss: A stop loss order is essential for managing risk. A logical place for the stop-loss is just below the matching low price of the two-candle pattern. This level is the clear support that was established. If the price drops below this, the pattern has failed, and the reason for being in the trade is no longer valid.
- Target setting: This is the price level where a trade is closed to take profits. There are several ways to determine this:
- Resistance levels: Look “left” on the chart to find the next clear area where the price previously stopped rising (a “resistance” level or a previous high). A profit target can be set just below this level.
- Risk/reward ratio: The target can be set as a multiple of the risk. For example, if the entry point is ₹10.50 and the stop-loss is ₹10.00 (a 50-paise risk), a 1:2 risk/reward ratio would place the profit target at ₹11.50 (a ₹1.00 gain).
- Trade management: As a trade moves in a positive direction, it can be managed. For instance, once the price has moved up by an amount equal to the initial risk (at ₹11.00 in the example above), the stop-loss could be moved up to the original entry price (₹10.50). This is known as a “break-even” stop, which aims to protect the trade from turning into a loss.
Common Mistakes & Limitations of the Matching Low Pattern
Although the matching low pattern can be a useful signal, it has limitations and common mistakes to avoid, such as:
- Rarity: The “classic” version of this pattern (with two perfect bearish candles and no lower shadows) is extremely rare. This means it will not appear very often on charts.
- False signals: The pattern can fail. It may look like a reversal, but it could just be a brief pause before the downtrend continues. This is why waiting for confirmation is very important.
- Ignoring the trend: The pattern is only a bullish reversal signal if it appears in a clear downtrend. If the market is moving sideways or already in an uptrend, this pattern is not valid and should be ignored.
- Not using confirmation: Relying on the two-candle pattern alone is risky. Entering a trade without waiting for a confirmation candle or checking other indicators (like volume or RSI) can lead to entering a failing trade too early.
- Liquidity: The pattern may appear more often in assets that are not heavily traded (illiquid markets). In these cases, its reliability may be lower.
Conclusion
To put it in simple words, think of the matching low candlestick pattern as a “pause” button on a downtrend. It shows that selling has stopped at a specific price. But a pause isn’t a reversal. Always use other tools like volume or indicators to confirm a new uptrend is actually starting.
FAQ‘s
The matching low candlestick pattern occurs during a downtrend and consists of two consecutive bearish candles with nearly identical closing prices. This pattern suggests that sellers are losing strength, indicating a potential support level and a possible upcoming bullish reversal if confirmed by further price action.
Common mistakes include trading the pattern without confirmation from a bullish third candle, ignoring the broader trend (it should appear in a downtrend), neglecting volume and other indicators, acting in illiquid markets where the pattern can generate false signals, and treating the pattern as a guaranteed reversal without supporting evidence.
To trade a Matching Low pattern, wait for a confirmation, typically a bullish candle closing above the highs of both bearish candles before entering. Set a stop-loss just below the pattern’s matching close. Profit targets should align with resistance levels or a favorable risk/reward ratio (often two times the risk).
The matching low pattern can be identified on any time frame, including intraday charts. However, it is considered more reliable on daily or weekly charts, as intraday signals are more prone to “false positives” due to market noise and short-term volatility.
The matching low is a relatively rare and moderately reliable bullish reversal pattern. Its effectiveness increases if it appears at a major support zone and is confirmed by a bullish candle and other technical indicators. Without confirmation, it is susceptible to false signals, especially in strong downtrends or choppy markets.