
Price looks strong, the chart is clear, and just when a trade is taken, the market reverses after a crossover signal. This is a common issue when using moving averages without understanding how they interact. The moving average crossover strategy is designed to simplify this by using two averages to generate structured buy and sell signals. However, studies show these strategies often have win rates around 40% to 60%, depending on market conditions. In this blog, we will understand how this strategy works and how the signals are identified.
What Is a Moving Average in Trading?
In technical analysis, a moving average is an indicator that denotes a line that shows the average price of a stock over a selected time range. Instead of focusing on every price movement, moving averages help traders see the broader market direction by filtering out small price fluctuations.
Instead of focusing on every small price change, moving averages present a cleaner view of how price is behaving over time.
Types of Moving Averages Used in Trading
Traders generally rely on two major moving average methods in market analysis. These are as follows:
- Simple moving average (SMA): Calculated by taking the mean of closing prices over a chosen number of periods, where each price point has the same importance.
- Exponential moving average (EMA): Designed to respond faster to new price data because it assigns higher importance to recent prices.
Now that we know what these types entail, let’s discuss them in detail.
Simple Moving Average (SMA)
The Simple Moving Average is the arithmetic average of prices over a given period. It is represented using the formula:
SMA = (P₁ + P₂ + P₃ + … + Pₙ) / n
where P represents closing prices and n is the number of periods.
Since the Simple Moving Average treats all past prices equally, it usually reacts slowly when the market price suddenly changes. This makes it useful for understanding broader price movement over time. However, it reacts slowly to sudden price changes, as older data carries the same weight as recent prices.
Exponential Moving Average (EMA)
The Exponential Moving Average adjusts more quickly to recent price movement, which makes it more useful for short-term trading. It is calculated using the formula:
EMA = Price × (2 / (n + 1)) + Previous EMA × (1 − (2 / (n + 1)))
where n is the selected period.
Because of this weighting method, the EMA indicator reacts faster compared to SMA. This makes it more suitable for shorter timeframes where quick response to price movement is required, such as intraday and swing trading setups.
What Is a Moving Average Crossover Strategy?
The moving average crossover method is based on comparing two averages of different time periods to identify trend changes. A crossover occurs when these two lines intersect on a chart.
When the short-term average moves above the long-term average, it usually indicates that the price trend is gaining upward momentum. When it crosses below, it reflects weakening price behavior.
This approach provides a rule-based way to identify potential entry and exit points, reducing the need for subjective decision-making.
How Moving Average Crossovers Work
The basic concept involves two moving averages:
- A fast (short-term) moving average
- A slow (long-term) moving average
When the fast average crosses above the slow one, it is generally seen as a bullish signal indicating potential buying opportunity. When it crosses below, it is seen as a sign of a bearish signal of weakening prices or a possible downtrend.
For example, if a 9 EMA crosses above a 21 EMA on a 5-minute chart, it reflects recent prices moving higher than earlier ones. Similarly, when a 50 SMA crosses below a 200 SMA, it shows weakening price movement over time.
These crossover points are used to identify possible buy or sell signals, though results may vary depending on market conditions.
Golden Cross Strategy (Bullish Signal)
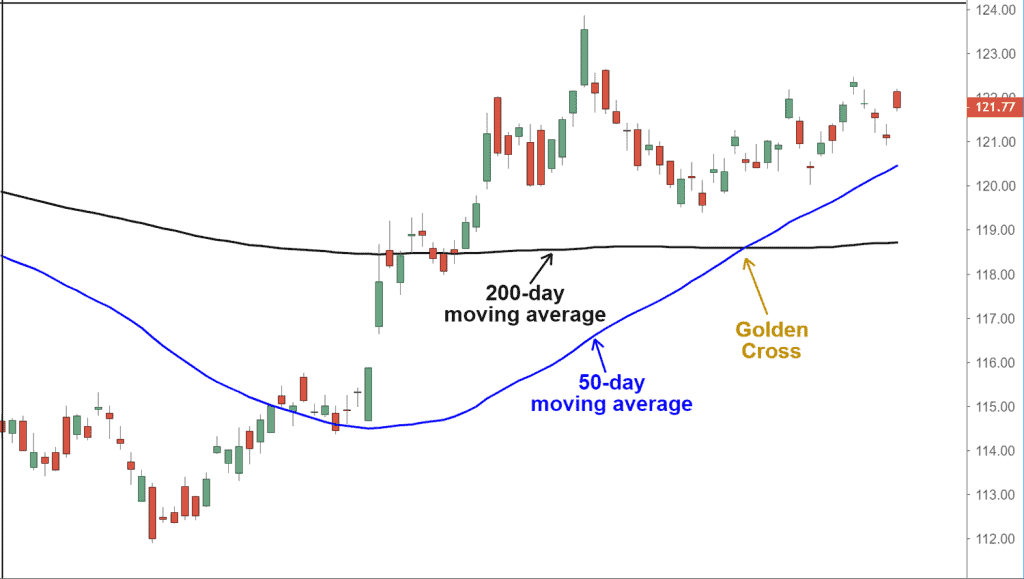
The golden cross is a widely followed pattern in the moving average crossover strategy and is generally associated with bullish market conditions. This crossover happens because recent prices begin moving faster in one direction compared to older price data. A commonly used example of this strategy is the crossover between the 50-day and 200-day moving averages.
This pattern is often observed on higher timeframes and is used to identify sustained upward price movement rather than short-term fluctuations. It reflects strengthening price action over time, although it may appear after the initial move has already started.
Death Cross Strategy (Bearish Signal)
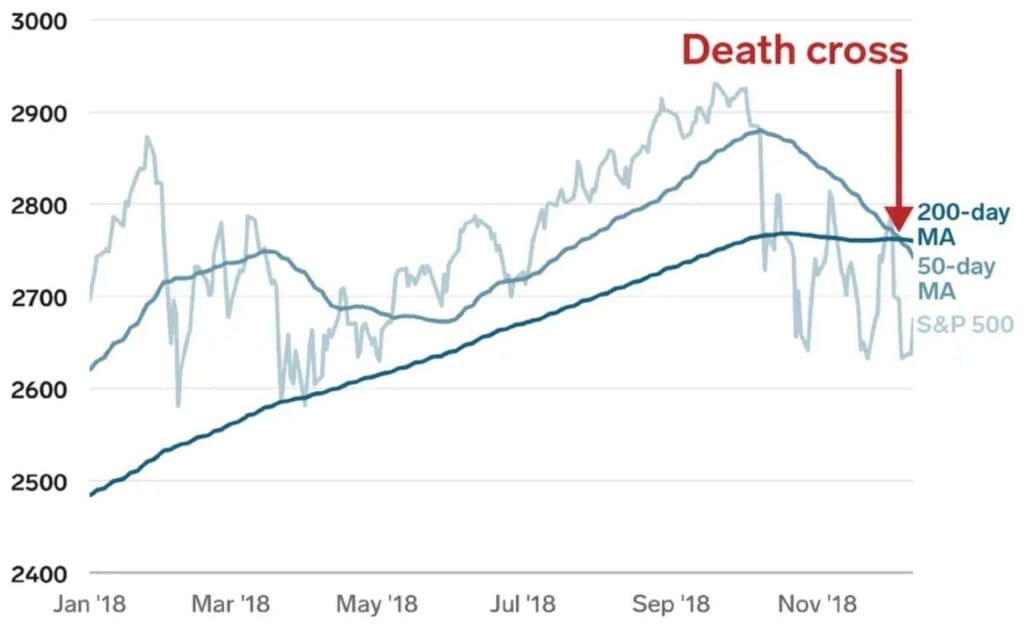
The death cross pattern represents the opposite situation of the golden cross, where market momentum shifts toward the downside. It appears when the short-term moving average moves below the long-term moving average, indicating declining price strength.
This pattern is usually observed on higher timeframes and is used to identify extended downward price movement. It reflects increasing selling pressure over time, although like other crossover signals, it may lag and appear after part of the decline has already occurred.
Best Moving Average Combinations for Trading
Different moving average combinations are used depending on trading style and timeframe. Short-term traders prefer faster combinations, while long-term traders use slower ones. The commonly used combinations are as follows:
9 EMA and 21 EMA Crossover Strategy
Short-term traders sometimes use combinations like the 9 EMA and 21 EMA to track short-term momentum changes. The 9 EMA represents recent price movement, while the 21 EMA reflects slightly broader price behavior. When the 9 EMA crosses above the 21 EMA, it shows that recent prices are rising faster, while a cross below indicates weakening price action.
This setup is widely used on shorter timeframes like 5-minute or 15-minute charts, where quick signals are required. However, due to its sensitivity, it may generate frequent signals in sideways conditions, making confirmation important.
50 SMA and 200 SMA Crossover Strategy
The 50 SMA and 200 SMA crossover strategy is one of the most widely followed approaches for identifying long-term price direction. The 50 SMA represents medium-term price movement, while the 200 SMA reflects broader price behavior over a longer period. When the 50 SMA crosses above the 200 SMA, it is commonly associated with upward price movement, while a cross below indicates downward movement.
This combination generates fewer signals compared to shorter averages but is considered more stable. This strategy is more commonly used on higher timeframes such as daily charts to identify stronger trends.
Moving Average Crossover Strategy for Intraday Trading
In intraday trading, moving average crossovers help interpret short‑term shifts in price momentum within a single session. On short timeframes such as 5‑minute or 15‑minute charts, crossovers help highlight areas where price may be gaining or losing strength relative to recent movement.
Since intraday markets can be noisy, traders often use crossovers along with real‑time price action and volume to filter weak signals and focus on moves that show clear direction within the trading day.
Moving Average Crossover Strategy for Swing Trading
For swing trading, moving average crossovers help identify broader price trends that may play out over several days or weeks. Swing traders look for crossover signals that align with larger market movements and trends, rather than reacting to short‑term fluctuations.
When a crossover aligns with sustained price movement and confirms with other market behavior like volume or trend structure, it can help traders capture extended gains. This approach focuses on meaningful price shifts over longer horizons rather than immediate fluctuations.
Best Timeframe for Moving Average Crossover Strategy
The timeframe used in a moving average crossover strategy affects signal frequency and reliability, shorter frames yield frequent but noisy signals, longer ones provide stable trend confirmation. Optimal choice aligns with trading style and market volatility. Commonly used timeframes include:
- 5-minute and 15-minute charts: Ideal for scalping intraday timeframe with 5/10 or 9/21 EMA crossovers; high signal volume but whipsaw risk.
- 1-hour charts: Balances speed and clarity for active traders using 20/50 SMA; filters minor noise.
- 4-hour and daily charts: Good for swing trading with 50/200 SMA (Golden Cross); reliable in trends.
- Weekly charts: Suited for positional strategies; fewer but high-conviction signals.
Step-by-Step Trading Setup Using Moving Average Crossovers
An organised trading setup helps in applying the moving average crossover strategy in an effective and efficient manner across different market conditions. The process is as follows:
- Pick appropriate moving averages: Choose a fast and slow average based on your trading style, such as 9 EMA and 21 EMA for short-term or 50 SMA and 200 SMA for broader analysis.
- Apply averages on the chart: Add both moving averages to the selected timeframe to clearly observe their interaction with price movement.
- Wait for price near principal levels: Observe how price behaves near support and resistance zones before focusing on crossover signals.
- Identify clear crossover points: Look for distinct intersections where the fast moving average crosses above or below the slow moving average.
- Confirm signal using indicators: Use tools like RSI or volume to validate whether the crossover has sufficient strength behind it.
- Define entry and exit levels: Plan entry, stop-loss, and target levels in advance based on nearby price zones.
- Monitor trade after execution: Track price movement and manage the trade based on changing market conditions.
How to Confirm Crossover Signals Using Indicators
Moving average crossovers are often combined with indicators for confirmation. Indicators help in validating whether the signal has strength behind it.
Common tools include RSI indicator to identify overbought or oversold zones and MACD to support crossover direction. Support and resistance levels are often combined with moving averages to confirm trading signals.
Using multiple factors helps reduce false signals and improves clarity.
Using Volume to Validate Moving Average Crossovers
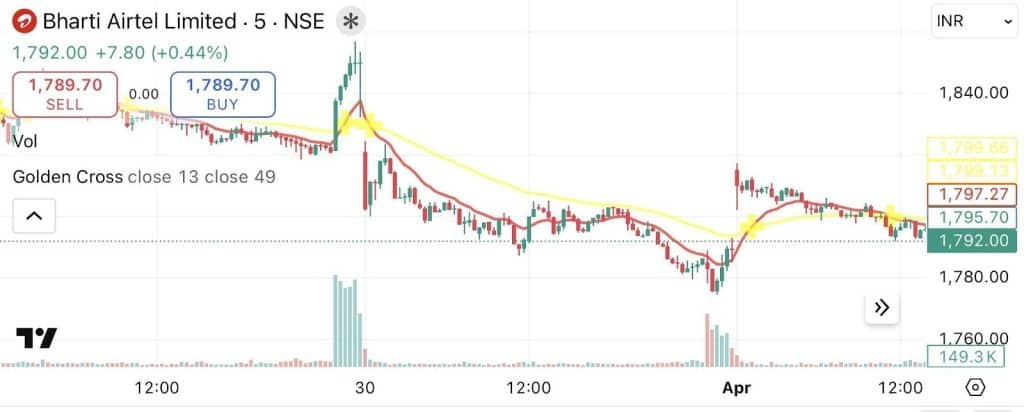
Volume analysis helps confirm the strength behind a moving average crossover signal by showing how many participants are involved in the price move rather than relying solely on the price line. When a moving average crossover is supported by above‑average volume, it suggests stronger conviction from buyers or sellers, making the signal more reliable. Conversely, a crossover on low volume may indicate weak interest and higher chances of a false signal. Volume confirmation is widely recommended in technical analysis as an additional filter to improve the quality of crossover signals.
For example, on the 5-minute chart for Bharti Airtel Limited on April 3, 2026 shown below, a bullish gold cross occurred as the 13-period moving average crossed above the 49-period moving average. This specific signal was validated by a prominent surge in green volume bars at the bottom of the chart, indicating strong buying pressure at the 1,792.00 level. This high-volume participation confirmed that the crossover was not a whipsaw but a coordinated move by market participants to drive the price higher.
Risk Management in Moving Average Crossover Strategy
Risk management is essential in crossover strategies as signals are lagging and may appear after part of the move has already occurred. The key steps are as follows:
- Place stop-loss strategy based on price structure: Use recent swing highs or lows instead of fixed points to define risk.
- Avoid trading during sideways movement phases: Crossovers generate frequent false signals when price lacks clear directions.
- Limit exposure per trade consistently: Risk only a small percentage of capital to manage drawdowns effectively.
- Focus on high-quality crossover setups only: Filter signals based on price levels and confirmation rather than frequency.
- Avoid reacting to delayed crossover signals: Entering after a large move reduces the effectiveness of the setup.
- Adjust risk based on timeframe used: Shorter timeframes require tighter risk control due to faster price movement.
- Maintain discipline during multiple signals: Avoid stacking trades when repeated crossovers appear in short duration.
Common Mistakes Traders Make While Using Crossovers
There are several typical mistakes traders make while using crossover-based trading strategies;
- Using crossovers without price context clearly: Ignoring support, resistance, or structure reduces signal reliability
- Applying crossover strategy in range-bound markets: Frequent crossovers in such conditions create inconsistent trade outcomes
- Depending only on crossover signals completely: Lack of confirmation leads to weak setups and false entries
- Choosing incorrect moving average combinations: Using mismatched averages leads to delayed or irrelevant signals
- Entering trades after strong price expansion: Late entries reduce reward compared to risk taken
- Taking every crossover signal without filtering: Overtrading increases exposure without improving outcomes
- Ignoring execution speed in fast markets: Delayed execution impacts results in intraday and short-term trading.
Advantages and Limitations of Moving Average Crossovers
Using moving average crossovers offer many advantages in technical analysis but also come with certain limitations depending on market conditions.
Advantages:
- Provides clear buy and sell signals based on crossover points.
- Helps identify overall price direction more easily.
- Works effectively in strong directional market conditions.
- Reduces short-term price fluctuations through smoothing.
- Can be applied to different markets, timeframes, and trading strategies.
- Offers a rule-based approach for consistent decision-making.
- Easy to understand and widely used across different markets.
Limitations:
- Signals appear late due to the lagging nature of averages.
- Generates frequent false signals in sideways market conditions.
- Do not consider external factors such as economic news or major announcements.
- Results vary depending on selected moving average periods.
- Requires additional confirmation tools for better reliability.
- May lead to late entries after significant price movement.
- Can create confusion with frequent crossovers in short timeframes.
Is Moving Average Crossover Strategy Profitable?
The moving average crossover strategy can be useful in markets where price moves in a particular direction. However, its performance may vary depending on whether the market is trending or moving sideways.
Studies suggest that crossover strategies often show moderate win rates and may underperform when used alone, especially after accounting for transaction costs. Its effectiveness is based on how it combines moving averages with other indicators to improve accuracy.
Conclusion
Overall, the moving average crossover strategy helps traders convert complex price movements into clearer trend signals. By blending fast and slow averages with volume and risk management, traders gain a clearer lens on price action. It’s not just a tool, it’s a disciplined approach to navigate charts, spot opportunities, and trade with greater accuracy.