Why Use Moving Averages in Intraday Trading?
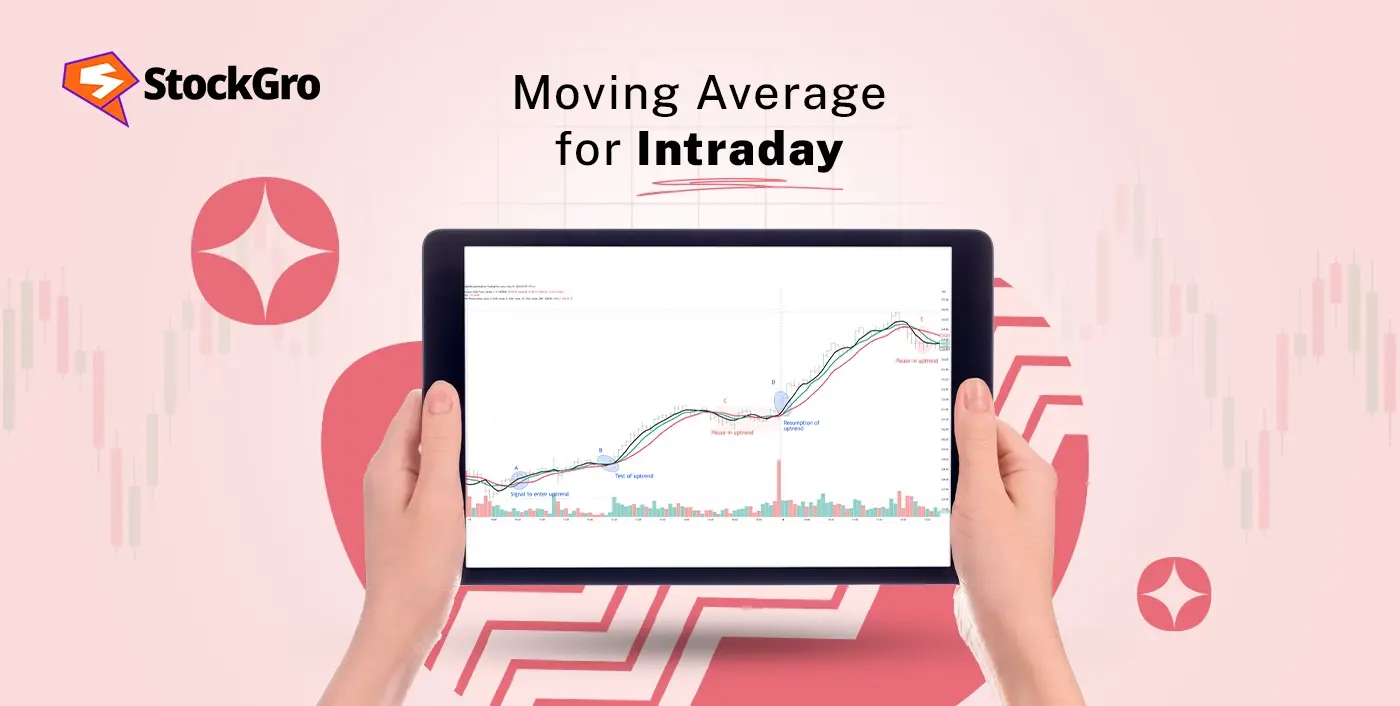
Moving averages help traders understand how the price is moving during the day. When a stock’s price stays above the line, it signals upward price action; if below, it shows downward movement. A flat moving average often means the price is stuck between a steady range of highs and lows. They also act as flexible support or resistance during intraday trading moves. In upward phases, prices often pause or rise near the line; in downward phases, they may fall from it. Since moving averages are calculated from past prices, they confirm price direction after it has already moved.
Types of Moving Averages for Intraday Trading
The different types of moving average for intraday trading include the following:
- Simple moving average (SMA)
It takes the closing prices for a set number of periods, adds them up, and divides by that number. A 10-period simple moving averages calculates the mean of the most recent 10 closing values. It gives equal importance to all values in that range.
- Exponential moving average (EMA)
This type gives more importance to recent prices, making it quicker to react to price movements. Traders frequently rely on the exponential moving average to follow near-term price directions.
- Weighted moving average (WMA)
The weighted moving average (WMA) gives varied emphasis to each value, prioritizing newer prices. This helps traders concentrate more on current price movement.
HMA combines multiple weighted averages to create a line that reacts quickly while reducing lag. It helps in identifying direction more clearly on shorter timeframes.
Best Moving Average Settings for Intraday Trading
The choice of settings depends on the time frame and strategy. A common setup used by traders is the 5-8-13 Moving Averages rule, useful for both upward and downward price moves. On a 1-minute chart, 10-day and 20-day SMAs can be applied for quick trades. These same settings work on 5-minute charts as well. For crossover strategies, the 50-period EMA and 200-period EMA are widely used on 1-hour charts. A buying indication shows when the 50 EMA moves above the 200 EMA; a selling sign shows when it dips below. Always compare with other chart details before acting.
How to Use Moving Averages for Intraday Trading
These are common techniques for using moving averages for intraday trading:
- Begin by observing the direction of the moving average line. If it’s sloping upwards, prices are generally rising; if downward, prices are generally falling.
- Watch for prices crossing the moving average. A move above the line may indicate an opportunity to enter a trade; a move below may suggest an exit.
- Use the line as support or resistance. When price approaches the average from above, it may bounce; when approaching from below, it may stop or reverse.
- Combine with other indicators like volume or RSI to reduce misleading signals and confirm trade setups.
Popular Moving Average Strategies for Intraday
Intraday traders often pair moving averages with other tools for better technical analysis and reduced noise. Here are some commonly used strategies:
- Moving average crossover strategy
A moving average shows the average price over a period. This strategy uses two EMAs, one short-term (like 9 or 10) and one long-term (like 21 or 50). A crossover happens when the short EMA moves above or below the long EMA, helping spot early price direction changes.
- Moving average + VWAP combo
VWAP (Volume-Weighted Average Price) shows a stock’s average rate for the day, adjusted by traded volume. Used alongside a moving average, it offers added confirmation. For example, traders may prefer setups where price stays above both VWAP and EMA.
- Moving average with RSI
Relative strength index how strongly price has moved, on a scale of 0 to 100. When paired with a moving average, it adds a second layer of confirmation. Traders typically check for price above the EMA and RSI above 50, aiming to avoid weak setups and false triggers.
- Moving average bounce strategy
A single EMA (like 20 or 50) is used as a reaction point. In this method, traders watch for price to approach and bounce off the moving average. This bounce is treated as an entry opportunity in the same direction, using the EMA to frame risk and targets.
Moving Average Timeframes for Intraday
For intraday, moving averages must respond quickly to price changes. That’s why many traders prefer EMA (Exponential Moving Average), which reacts faster to price changes than SMA (Simple Moving Average), which responds more slowly.
- 1-minute chart: Use a 20-period EMA or 50-period SMA. For clearer signals, shift to 5- or 15-minute charts where price patterns are more stable.
- 5-minute chart: A 10-period EMA or 20-period SMA works well to follow short-term moves without too much noise.
- 15-minute chart: A 20-period EMA shows recent price direction clearly. You can also overlay a longer-period MA for context.
- 1-hour chart: Use a mix of 20 and 50-period EMAs. The 50 EMA helps mark support or resistance zones across the day.
Advantages of Using Moving Averages for Intraday
Moving averages help simplify market activity for short-term trades. Its main benefits include:
- Smoother price visualisation: Filters out minor price jumps to show a more stable movement, making it easier to understand market direction.
- Direction recognition: The angle of the moving average line can suggest whether the price is generally rising or falling over the selected timeframe.
- Key price zones: Helps identify areas on the chart where price has previously bounced or stalled, useful for spotting repeated reactions.
- Entry and exit indications: A price crossing above or under the average line can signal a shift important for timing trades.
- Adaptable across charts: Works on 1-minute to hourly charts, allowing traders to apply the same concept on different time intervals or instruments.
Limitations of Moving Averages in Intraday
Moving averages can be helpful, but they also come with some clear limitations such as:
- Moves after the price: Since moving averages use past data, they adjust only after prices have already changed, which can delay your response.
- Doesn’t show what’s next: These indicators highlight past movement but don’t give any signal about where the price might go.
- Can mislead in fast markets: Quick price jumps can create false breakouts or crossovers, leading to wrong trade signals.
- Not built for flat markets: In sideways markets, the moving average offers little help as price moves up and down without direction.
- Misses other market clues: It doesn’t account for volume, news events, or other important pieces of information that affect price.
- Heavily affected by time settings: If the period is too short, it may give too many signals; if too long, it may react too slowly.
Conclusion
The moving average for intraday isn’t about spotting what’s next, it’s about making sense of what just happened. It shows price direction, acts as a flexible support or resistance, and helps time entries with better structure. Put together with tools like VWAP or RSI, it brings order to charts where every second counts. It’s a simple tool that keeps things readable without adding clutter.
FAQs
The exponential moving average (EMA) is widely considered best for intraday trading. EMA reacts faster to recent price changes than the Simple Moving Average (SMA), making it useful for timely decision-making in fast-moving markets like intraday trading.
The 5-minute moving average strategy typically involves using short-period EMAs, such as 9, 20, or 21, sometimes combined with momentum indicators like MACD or RSI. Traders look for price crossing the EMA and confirmation from other signals to identify trade opportunities on 5-minute charts.
For 15-minute charts, the 20-period EMA is frequently recommended. It adapts quickly to price actions and provides clear trend signals suitable for short-term trading. Some strategies also use a combination of 9 and 20 EMAs for this interval.
While moving averages can help show market direction and smooth price movements, most traders avoid relying on them alone. They work best when combined with other indicators or patterns, as using moving averages by themselves can lead to false signals in intraday trading.
EMA is usually preferred for day trading since it gives more weight to recent prices, enabling quicker responses to price changes and sharper signals. SMA uses equal weighting and responds more slowly, which is better for long-term analysis.

