
A breakout with no volume is just a number moving on a screen, easy to catch your eye, but often unreliable. Intraday charts are full of such signals that look strong but fade fast. What’s missing is participation. Volume tells you if the market is actually interested. That’s why relying on price alone can lead to poor entries.
Price volume breakout puts both elements together, price action and volume to filter setups with genuine strength. In this blog, we’ll discuss what it means, how to identify it on charts, and how to use it as part of a stronger trading approach.
What is a Price Volume Breakout?
A price volume breakout occurs when a stock’s price moves beyond the support or resistance level to signalling potential market shifts. This increase in both price and volume means more people are entering the market, adding strength to the move.
In breakout trading, volume acts as a confirmation that the price action is backed by buying, not just a spike. Without volume, such price movements are often considered unreliable. A breakout backed by strong volume shows that the price move is being supported, not just by price patterns but by actual participation.
How to Identify a Price Volume Breakout
In technical analysis, identifying a price volume breakout, checking for strong price action along with meaningful volume support is important. To do so, the key steps include:
- Using Candlestick Patterns
Start by identifying a consolidation phase, where the stock moves within a fixed price band defined by horizontal support and resistance levels. During this time, the price action is mostly sideways and shows limited movement.
A breakout is considered valid when a strong candlestick, typically a large bullish candle with a solid body and minimal work closes decisively above the resistance line. This closing price must be outside the established range, not just an intraday spike.
The size of the candle body also matters; a narrow or indecisive candle doesn’t qualify as a strong breakout signal. It’s important that the breakout candle follows a clear consolidation, not just random movement. Gaps accompanied by a strong candle can also qualify, provided the price sustains above resistance till the close of the session.
- Using Volume Indicators
Volume is the confirmation layer. During the sideways range, volume tends to be low. On the day of breakout, a significant increase in volume noticeably above the average of the last few sessions is essential.
For example, if the usual volume has been 1 lakh shares and it suddenly rises to 3–4 lakhs on breakout day, it signals strong interest. This rise should align with the breakout candle. A low-volume breakout can easily reverse, especially if it lacks follow-through in the next session. Also, if volume rises without a price breakout, it may suggest accumulation but not a confirmed breakout yet. Reliable breakouts usually show both a clear price move and a supporting volume surge.
Price Volume Breakout Strategy
To apply the price volume breakout strategy, a structured approach using price levels and confirmation tools is followed. The main components are as follows:
- Combining Support & Resistance
The first step is identifying a price range that has held steady, forming a base. Support is where price has bounced from, resistance is where price has failed to cross. Once these levels are clear, a breakout is only valid when price closes beyond the resistance or support, not just touches or briefly goes through it.
The more often these levels have been tested without breaking, the stronger they are considered. Entry is planned only after a clear closing breakout, while stop-loss levels are placed just outside the breakout candle below it for long trades and above it for short trades to manage risk within a defined range.
- Confirming with Moving Averages
Moving averages help assess whether the breakout move is gaining follow-through. A crossover like the 10-period MA moving above the 50-period MA can confirm. For example, after a breakout above ₹300, if the 10MA crosses and stays above the 50MA, it indicates that price is holding up. This extra filter helps avoid reacting to one-day spikes that fail.
If price goes back below both averages soon after the breakout, it’s a sign of weakness. Ideally price should stay above the short term average and the averages should start to slope in the direction of the move, showing follow through after the breakout.
Example of a Price Volume Breakout Trade
Now that we know the basics, let’s take examples to understand how price volume breakout works in real trades.
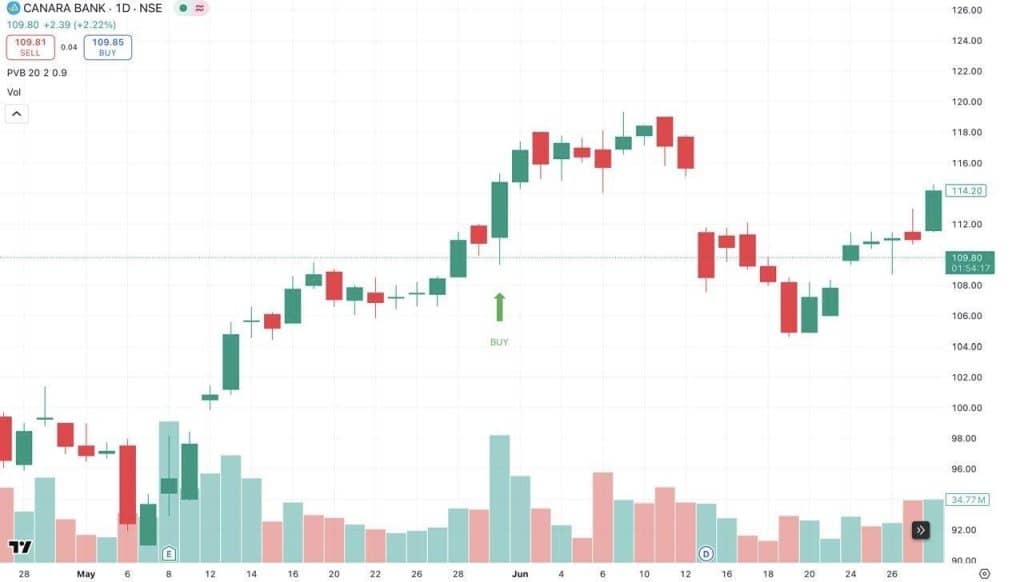
In the chart below, Canara Bank broke out of a narrow range on May 28, 2024, with a sharp rise in volume. The stock had been moving in a narrow range for several sessions, and the strong closing candle with volume confirmed the breakout. Prices moved steadily higher in the following sessions.
In this second chart, Asian Paints Ltd on June 3, 2024, broke below a well-defined support level. This was a classic bearish breakout, as the price not only broke support but also closed firmly below it with strong participation.
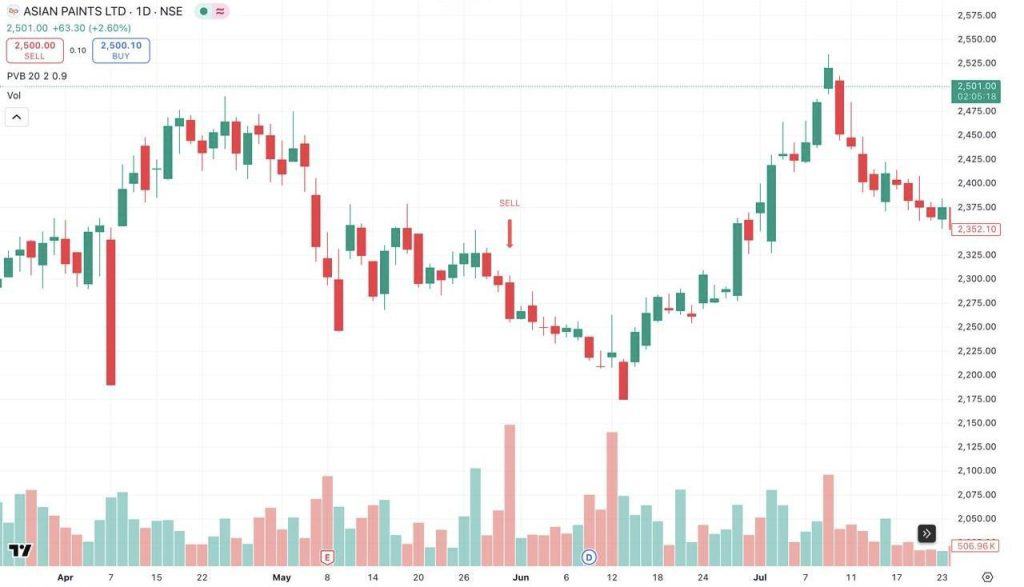
The stock saw a steady fall afterward. In both cases, volume confirmed the price move, helping separate valid breakouts from random price spikes.
Common Mistakes to Avoid
These errors are frequently made while trading price volume breakouts and can weaken trade outcomes. Some of the most common ones are as follows:
- Chasing false breakouts: Jumping into a trade the moment price crosses a resistance level without waiting for the candle to close can be risky. Price may reverse intraday, trapping early entries. Waiting for a full candle close reduces such traps.
- Ignoring volume: Watching price without volume is incomplete. A price rise without strong volume can be misleading, as it may not have the support of broader participation. Always check if the breakout is backed by higher than normal volume.
- Not having a plan: Trading without a plan for entry, stop loss and target can lead to impulsive, emotional decisions. Knowing where you will exit, both for profit and loss adds structure and reduces risk.
- Not looking at market conditions: Even a strong breakout on a stock can fail if the overall market is moving in the opposite direction. Not looking at broader market behavior can lead to lower success rates, especially during sharp reversals.
- Setting stop-loss too close: Placing stop loss just below the breakout level can get you taken out by small pullbacks or retests, even if the move continues later. Give some space to avoid being exited by normal price movements.
Advantages and Limitations of Price Volume Breakout
Every strategy comes with its own strengths and challenges, and price volume breakout is no exception. Some of which have been discussed below.
Advantages
- A main advantage is the potential to enter a new trend at its early stages, which can offer significant profit potential if the trend sustains.
- The inclusion of volume acts as a natural filter, helping to distinguish between strong, conviction-backed moves and weaker, less reliable signals.
- The strategy provides clear and defined levels for placing entry and stop-loss orders based on the broken support or resistance levels.
- It can be applied across various timeframes and to different types of securities, including stocks, commodities, and currencies.
Limitations
- The primary limitation is the occurrence of “false breakouts,” where the price breaks out of a range only to quickly reverse, trapping traders.
- The signals are lagging by nature as they are based on price action that has already happened. By the time a breakout is confirmed, some of the price move may have already occurred.
- In very volatile or choppy setups, the strategy can generate many false signals as price can move erratically without a clear trend.
- Requires patience as traders often have to wait for long periods of consolidation before a valid breakout opportunity appears.
Conclusion
Price volume breakout filters out weak moves by checking if price and volume are in agreement. Instead of reacting to every price spike, this approach waits for confirmation through levels and participation. It’s used in intraday and swing trading because it builds structure into entries and exits, especially in volatile charts where price alone may not tell the whole story.
FAQs
A volume breakout strategy looks for big moves in price backed by a big surge in volume. When a stock’s price breaks out of a level with much higher volume than normal, it can be a sign of a new trend or direction.
Few of the most useful indicators for volume breakouts are volume bars, volume weighted average price (VWAP), on-balance volume (OBV) and the volume oscillator. These help spot unusual volume surges that often signal the start of a big price move.
To reduce false breakouts, traders often wait for a price close above or below the breakout level and look for strong accompanying volume. Confirming the move with other indicators, or checking if the market is trending, can also help filter out unreliable breakouts.
Yes, volume breakout strategies are used in intraday trading. They help spot strong price moves as they start. But fast moving markets can generate false signals so using additional confirmation tools or waiting for price to settle is often helpful.
Price volume breakouts can work in swing trading as well. When breakouts occur with strong volume on daily or 4 hour charts, they can be a sign of a multi day move, helping swing traders spot potential entries and time their trades better.