A common challenge in trading is deciding the entry and exit points. The price alone can give false signals, especially when the markets are volatile. This is where the RSI indicator comes in with a solution. It indicates shifts in market momentum and helps to identify trend reversals, which is useful for determining the trade positions.
This article will guide you through the RSI indicator, how it works, the best settings to use, and how the RSI divergence gives buy and sell signals.
What is the RSI Indicator in Trading?
The Relative Strength Index (RSI) shows when momentum is changing by tracking how quickly and how strongly a price moves. It was created by J. Welles Wilder Jr. Traders often use it because it’s easy to understand and works well in many markets – stocks, indices, crypto, and forex. RSI also fits different timeframes and trading styles, which makes it a reliable tool for both new and experienced traders.
How Does the RSI Indicator Work?
RSI compares the average of gains and losses over a specified time period to determine the market momentum. It assigns this information a single value between 0 and 100, making it easy to identify whether the bulls or bears are dominating the market.
Oversold Zone (RSI Below 30)
- The stock has been sold heavily and may be losing downward strength.
- Sellers are slowing down, and buyers could start showing interest again.
- Useful for spotting early signs of trend reversal when confirmed by price action.
Overbought Zone (RSI Above 70)
- The stock has been bought aggressively and may be losing upward momentum.
- Buyers are getting weaker, and selling pressure is increasing.
- Helps to identify areas where a pullback or reversal could start.
RSI Levels Explained (0–100)
Understanding the RSI levels helps in avoiding premature entries and setting up better trades. The different levels of RSI can be interpreted as follows:
0-30
An RSI score from 0-30 indicates that the shares are oversold. The buyers will soon start to step in, and bullish momentum will begin.
30–70
This range sits between oversold and overbought levels. When RSI is between 30 and 50, the trend is often unclear, but once it moves toward the 50–70 zone, momentum usually begins strengthening in the upward direction.
70-100
When the RSI crosses over 70, it is in the overbought zone. The sellers are likely to step in and drive a bearish momentum shift.
RSI Buy and Sell Signals
RSI generates clear momentum-based signals that help in identifying buy and sell opportunities. These signals become stronger when combined with market structure.
RSI Buy Signal (Oversold Zone)
A buy signal happens when RSI falls below 30 and then quickly jumps back above 30. This sudden shift suggests buyers are regaining strength.
Ideal Buy Conditions:
- RSI climbs from oversold to neutral zone, showing early strength.
- Price sits near a support level, where declines often slow down.
- A bullish candle forms, giving a small confirmation of upward interest.
- Volume increases, helping validate that buying pressure is actually building.
RSI Sell Signal (Overbought Zone)
RSI gives a sell signal when it moves above 70 into the overbought zone and then suddenly drops below 70 again. This suggests that momentum is weakening.
Ideal Sell Conditions
- RSI crosses the overbought zone and falls back.
- The price is near the resistance level.
- A bearish candle pattern appears on the chart.
- The selling volume is increasing.
Most Accurate RSI Settings for Buy and Sell
The standard RSI setting is 14. It works well across most markets, but it can be adjusted depending on trading style, and timeframe.
Markets with fast movement benefit from shorter RSI periods, while longer-term investors prefer smoother signals using longer settings.
The best RSI settings for common market types are:
| Market Type | Timeframe | Suggestion | Reason |
| Intraday | 1-min, 5-min, 15-min | RSI 7 or 9 | Helps to capture quick price movements |
| Swing Trading | 1-hour, 4-hour, Daily | RSI 14 | Offers a balanced overview and is widely tested |
| Long-Term | Weekly, monthly | RSI 21 | Filters out short-term fluctuations to indicate longer trends |
RSI for Intraday Trading
In intraday markets, RSI helps recognise short-term exhaustion and sudden reversals.
- A buy opportunity often emerges when RSI moves above the oversold zone after briefly falling under it. This upward transition indicates improving strength.
- A sell opportunity can appear when RSI falls under the overbought zone after crossing above 70, signalling that momentum is fading.
Using tight stop-losses helps to protect your capital from sudden movements.
RSI for Swing Trading
In swing trading,
- When the RSI recovers from oversold levels and the price is near the support levels, it hints at a buy setup.
- A sell setup arises when RSI falls from overbought levels, confirming weakness from the buyers.
Swing traders often pair RSI with chart patterns to validate reversals.
Confirmation Indicators to Use with RSI
Traders often use RSI in combination with other indicators for confirmation. It helps in validating the trend strength and reducing false signals.
Volume: Volume adds strength to the signal. When RSI is backed by volume, the possibility of a momentum shift is higher. When the volume is weak, it means that the trend may be weak or for a short duration.
Moving Averages: The moving average (MA) helps us in identifying the market direction. When RSI moves with the MAs the signal is more reliable.
MACD: The Moving Average Convergence Divergence (MACD) helps in validating the strength, direction, and duration of a momentum. When it is used with the RSI, it leads to confident trade setups.
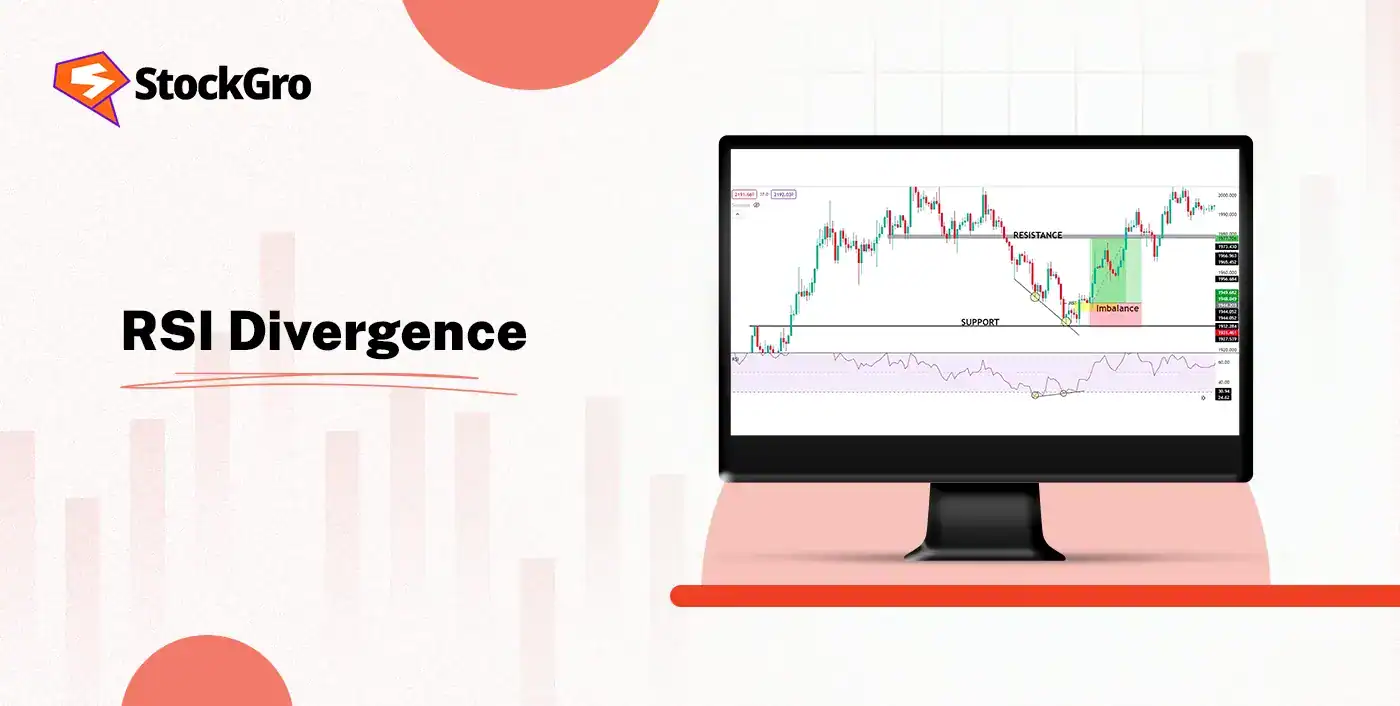
RSI Divergence Buy and Sell Signals
An RSI divergence happens when the stock price and RSI move in opposite directions. It means that the momentum is weakening and a trend reversal is about to take place.
Bullish Divergence (Buy Setup)
Bullish divergence is useful for identifying a potential upward reversal even when the price is still falling. To use it for a buy setup, check for:
- Price making lower lows: Bullish divergence appears when price keeps falling to new lows, but RSI doesn’t follow. This shows that selling pressure is losing strength.
- RSI making higher lows: If RSI begins forming higher lows even while the price is dropping, it signals a momentum shift and hints that buyers may start taking over.
- Wait for RSI to move above the oversold zone: The reversal becomes more dependable once RSI climbs into the 30–40 range, showing that strength is building.
Bearish Divergence (Sell Setup)
Bearish divergence highlights early signs of a potential downward reversal even when the price continues rising. You can use it for a sell setup when:
- Price makes higher highs:
When the price keeps touching new highs but RSI doesn’t move up with it, it creates a bearish divergence. - RSI forms lower highs:
When the RSI makes lower highs even with rising prices, the momentum is weakening and a reversal is near. - Watch RSI drop below the overbought zone:
A sell signal becomes clearer when RSI moves below 70, and even stronger when it falls close to the neutral zone.
RSI Signals with Support & Resistance
Support and resistance levels enhance the accuracy of RSI signals as they show the previous zones where prices have paused or reversed. These levels reduce the risk of false signals, and help in setting better entries and exits.
Support
When the price is close to the support level, and RSI is in the oversold zone, a bullish momentum is about to begin. The buyers look to step in and drive the prices higher. A buy setup often shows up when the RSI sits somewhere between 30 and 40, and a bullish candle forms right around that time. It’s a small sign, but it usually hints that the selling phase is easing off.
Resistance
When the price starts moving toward a resistance area and RSI slips into the overbought zone, the move usually begins to lose strength. That’s when a downward shift becomes much more likely. Sell setups become stronger when RSI drops from 70 to 65, especially if accompanied by a bearish candle.
RSI Signals Mistakes to Avoid
Although RSI is an effective tool, traders often get trapped in these mistakes when using it:
1. Ignoring the trend
Many traders ignore the trend and just use the RSI. They enter a long position during a downtrend or take a short position during a clear uptrend. RSI gives the best results when it is utilised in the direction of the market rather than fighting against it.
2. Skipping Support and Resistance
The support and resistance levels add validity to the trend strength. Using RSI without checking it often leads to false entries.
3. Wrong Timeframes and Settings
Appropriate timeframes and settings based on your trading style and market volatility should be used. Applying RSI 21 for intraday or RSI 9 for position trades can weaken the accuracy of the signal.
4. Not Adapting to Volatility
It is common to overlook how the volatility affects RSI behaviour. When the markets are highly volatile, the RSI can stay in wrong zones leading to trading errors.
5. Overloading Indicators
Using too many indicators with RSI can create confusion and produce mixed signals. A simple setup that combines RSI with the market behaviour and one or two indicators is usually the most effective.
6. No Volume Confirmation
The trading volume adds strength to the signal. The lack of volume in a signal reduces the possibility of a reversal.
Conclusion
The RSI indicator is a useful tool to read momentum shifts, spot trend reversals, and plan trades. By understanding the RSI levels and combining it with other indicators make the signals more effective. Although RSI is powerful, it performs best when used with proper risk management and avoiding common mistakes. With the right approach, RSI turns into a straightforward and reliable tool for intraday, swing, and long-term trading across different market conditions.
FAQs
The best buying zone appears when RSI falls below 30 and then rises into the 30–40 range. This pattern indicates that selling pressure is easing and early upward momentum is beginning to form.
A strong selling zone forms when RSI moves above 70 and then declines into the 60–65 range, signalling fading upward momentum and a higher chance of a corrective move.
The RSI 14 setting is widely regarded as the most balanced and accurate for general analysis. Faster settings, such as RSI 9, react quickly to price changes and may highlight short-term movements, but can increase the number of false signals. Longer settings like RSI 21 produce smoother momentum readings and are more suitable for broader, long-term trend assessment.
RSI is well-suited for intraday timeframes because it responds quickly to momentum changes. Settings such as RSI 7, 9, or 14 are effective in identifying rapid reversals, pullbacks, and breakout confirmations in shorter intervals.
RSI is capable of signalling possible trend reversals by identifying overstretched buying or selling conditions. These indications gain reliability when supported by price movement structure, candlesticks, or other momentum indicators.
RSI divergence occurs when the price and RSI move in opposite directions. It highlights weakening momentum and often signals powerful reversals ahead.