
Bullish trends can be misleading, just when things seem stable, the market flips. Spotting that shift too late can cost you clarity. The three outside down candlestick pattern captures this turning point. This blog explains how the pattern signals a possible reversal and helps identify early signs of weakening buyer control.
What is the Three Outside Down Candlestick Pattern?
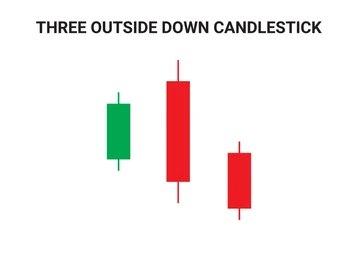
The three outside down is a bearish candlestick pattern that forms over three days during an uptrend. It starts with a green candle showing strong buying, followed by two red candles that signal selling pressure taking over. The second candle typically engulfs the first, while the third extends the downward direction. This shift shows that sellers have started to gain control after buyers dominated. The pattern often shows up near the end of an uptrend and can indicate that the upward movement may be losing strength.
How is the Three Outside Down Pattern Formed?
This pattern takes shape over three trading sessions when the market is rising.
- The first candle is green, showing buyers were still in control.
- The second candle is red and larger, opening above and closing below the previous candle fully engulfing it.
- The third candle is also red and closes even lower, continuing the downward direction.
- This sequence suggests that selling pressure has started to build after a period of consistent buying.
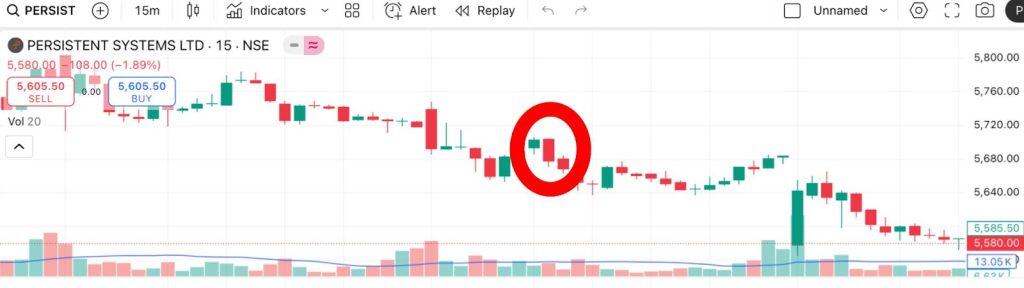
- The pattern is complete when all three candles appear consecutively, often marking the end of an uptrend as appearing in the chart of Persistent Systems Ltd. as of 23 July 2025.
Psychology Behind the Three Outside Down
The three outside down pattern reflects a change in who’s in control buyers or sellers.The first bullish candle shows the ongoing buying trend, though it may be smaller than earlier ones, hinting at fading momentum. On the second day, the price opens higher but closes much lower, a sign that sellers are stepping in strongly. The third day continues the sell-off, confirming that buyers are no longer leading. This shift often appears near resistance zones, where more sell orders are placed. The combined pressure from these orders contributes to the pattern’s formation and reinforces bearish sentiment.
When and Where Does the Three Outside Down Pattern Appear?
The Three Outside Down pattern usually appears at the end of an uptrend, but it can also form after a sideways phase when the market struggles to break higher. This formation is more commonly noticed on daily or weekly timeframes, where it may stand out more clearly. This pattern may appear in stock markets, forex, indices, or commodities, anywhere candlestick analysis is used. It often occurs near key resistance levels, where buying pressure weakens. While it can appear on any time frame, from intraday to monthly, its relevance increases when it follows a prolonged rise and signals growing bearish interest.
How Often Does the Three Outside Down Occur?
The three outside down pattern is not a frequently occurring pattern. As it requires a precise three-candle sequence. It doesn’t appear on every chart or trend, making it less frequent than simpler patterns. However, it tends to show up more often in volatile markets like cryptocurrencies or forex, where price swings are sharper. On shorter time frames, such as hourly charts, its appearance may increase, though with lower reliability. Its rarity on longer time frames may give it more significance when it does occur.
How to Identify the Three Outside Down on a Chart
You can spot the three outside down candlestick pattern by observing how each of the three candles behaves.
- First Candle: Look for a bullish candle, which shows the market was previously rising.
- Second Candle: A bearish candle that opens higher but closes within the first one’s body, hinting at a possible loss of upward strength.
- Close of Second Candle: Ideally, the second candle extends at least midway into the body of the initial candle.
- Third Candle: The third candlestick tends to close beneath the first candle’s lowest point, indicating sustained downward sentiment.
What Does the Candle Colour Tell in Three Outside Down?
Candle colours play an essential role in understanding the pattern’s reliability and the market tone. In the three outside down pattern, the first candle should be green or white (bullish), showing upward momentum. The next two candles must be red or black (bearish), indicating increasing selling pressure. The third candle is the most important, it should close below the second candle’s low. If this last candle isn’t bearish, the pattern loses its reliability. The colours visually show how control moves from buyers to sellers.
How Accurate is the Three Outside Down Candlestick Pattern in Technical Analysis?
In this technical analysis, pattern’s accuracy depends on trend strength, time frame, and trading volume.It tends to work better when the market is clearly trending upward before the pattern forms. A stronger uptrend means a clearer shift when the pattern appears. It’s also more reliable on daily or weekly charts because those time frames reduce random market noise. On lower time frames, like hourly or fifteen-minute charts, the pattern may give mixed or false signals due to short-term volatility.
When is the Best Time to Trade the Three Outside Down Pattern?
This pattern can be more meaningful when it aligns with other known price zones. It often appears near resistance zones or major Fibonacci retracement levelsC places where prices tend to pause or reverse. In such spots, the pattern may reflect market hesitation or exhaustion. For added reliability, traders usually confirm it using tools like RSI or MACD. When all these conditions come together, the pattern may suggest a shift back in the direction of the overall trend.
How to Trade Using the Three Outside Down Candlestick
Here’s a simple four-step process to start using this pattern in trading:
- Identify the pattern: Spot a bullish candle followed by a larger bearish one that engulfs it, then a third bearish candle closing below the second.
- Confirm the pattern: Use other indicators like RSI, moving averages, or volume to support the signal.
- Place a sell order: Consider entering below the low of the third candle for a clearer entry.
- Set a stop loss: A common approach involves placing a stop above the highest point in the pattern.
While the pattern provides a structured setup, external factors like news or broader market trends should also be considered.
Confirmation Tools to Use with the Three Outside Down
To make the Three Outside Down Candlestick Pattern more meaningful, traders often look for added confirmation using supporting indicators:
- Volume Spikes: Volume indicates how many shares were traded during a particular period. A spike during or after the pattern supports stronger selling interest and confirms market participation.
- RSI: The Relative Strength Index (RSI) computes momentum on a 0–100 scale. If RSI is above 70 before the pattern forms, it suggests overbought conditions, adding weight to a possible reversal.
- MACD: Moving Average Convergence Divergence helps track the connection between two different moving averages over time. A bearish crossover or declining MACD line near the pattern may confirm growing downside pressure.
- EMA: Exponential Moving Average gives greater emphasis on recent price data to show trend direction. If the pattern forms below the EMA or price crosses below it afterward, it may reinforce the bearish signal.
Advantages of the Three Outside Down Pattern
The three outside pattern accompanies various number of strengths that make it useful when trading:
- Indicates possible trend reversal: It may reflect a change in direction from upward to downward movement, especially when buyers lose steam and sellers gain control.
- Helps spot weakness in the market: The pattern shows that bullish strength is fading, often during the early signs of a downturn.
- Gives clear entry and exit signs: Once the pattern is formed, it can help identify points where traders might choose to enter or exit based on further confirmation.
- Works with other tools: It can be used alongside moving averages, RSI, or support and resistance levels to improve clarity and reduce uncertainty.
Limitations of the Three Outside Down
While the pattern has strengths, there are certain limitations to be aware of.
- Can create false signals: Sometimes the pattern appears without any real shift in trend, leading to premature or incorrect decisions.
- Not always reliable: It may occur during a temporary price dip rather than a full reversal, giving mixed signals.
- Needs additional confirmation: Relying on this pattern alone may lead to missed context. Other indicators are often needed for a full picture.
- Open to interpretation: Different traders may read the same chart differently. That subjectivity can lead to inconsistent outcomes.
- Less effective in thin markets: The pattern works better in high-volume settings. In illiquid or low-volume markets, its signals might be weaker.
When the Three Outside Down Pattern May Fail
The three outside down candlestick pattern may not work well in markets that are moving sideways, where there is no clear upward or downward trend. It can also be misleading if it forms without a strong rise in prices before it. If the pattern appears during times when fewer trades are happening, it might not give a full picture of what the market is doing. Quick changes in market mood caused by headlines or broader developments can also affect how the pattern plays out. Because of this, it’s better to look at other signals too, instead of depending on this pattern alone.
Three Outside Down vs Three Outside Up Pattern Related Bearish Candlestick Patterns
Both three outside down and three outside up patterns suggest trend reversals, but in opposite directions. Here’s how they differ:
| Feature | Three outside down | Three outside up |
| Trend direction | Takes shape after an uptrend | Takes shape after a downtrend |
| First candle | Long bullish candle | Long bearish candle |
| Second candle | Small bullish/bearish (inside candle) | Small bearish/bullish (inside candle) |
| Third candle | Long bearish, finishes below the first candle’s low | Long bullish, finishes above the high of the first candle |
| Signal type | Possible bearish reversal | Possible bullish reversal |
Related Bearish Candlestick Patterns
This pattern is part of a larger bearish group. Some other are as follows:
- Bearish Engulfing: A strong bearish candle fully covers the previous bullish one; often seen before or as part of Three Outside Down.
- Three Inside Down: Includes a bullish start, a smaller bearish candle, and a third bearish candle closing lower.
- Evening Star: Shows buying exhaustion with a large bullish candle, a small candle, and a big bearish close.
- Dark Cloud Cover: Bearish candle opens above the prior bullish candle but ends below its midpoint.
- Hanging Man & Shooting Star: Single candles that suggest a weakening uptrend.
- Three Black Crows: Three falling red candles show sustained bearish control.
Conclusion
Simple in form but packed with meaning, the three outside down candlestick pattern shows when buying may be slowing down after a steady rise. While it shouldn’t be used alone, combining it with other signals and chart tools can give a more complete and reliable view of price behavior across different market conditions.
FAQs
The three outside down pattern is a bearish reversal candlestick formation indicating a possible shift from an uptrend to a downtrend. It consists of a bullish candle, a larger bearish candle that engulfs it, followed by a third bearish candle confirming downward momentum.
The three outside down patterns can appear on intraday charts like 5- or 15-minute intervals. While the structure remains consistent, its reliability might be affected by higher volatility and market noise typical of shorter timeframes.
The three outside down pattern is a bearish reversal pattern characterized by a small bullish candle, a larger bearish candle that engulfs it, and a third bearish candle closing lower, indicating growing selling pressure and possible trend reversal.
The opposite pattern is the three outside up, a bullish reversal pattern where a downtrend may turn upward. It features a bearish candle engulfed by a larger bullish candle, followed by another bullish candle confirming the move.
The pattern is generally seen as a fairly reliable bearish reversal indicator, especially when appearing near resistance areas or after strong uptrends. However, its accuracy may vary depending on market conditions and should often be considered alongside other indicators.
Bearish engulfing involves two candles where a bearish candle fully covers a prior bullish one. The three outside down adds a third bearish candle closing lower, providing stronger confirmation of the bearish reversal compared to the two-candle engulfing pattern.
The pattern is confirmed when the second candle completely engulfs the first bullish candle, showing a strong shift to selling. Then, the third candle closes lower than the second, indicating that sellers remain in control. Higher trading volume or other supporting indicators can add confidence to the signal.
Beginners can identify the three outside pattern because of its clear three-candle formation. However, understanding its significance usually requires considering market context and using additional tools, as no pattern alone guarantees direction.
The pattern is generally more reliable on longer timeframes, such as daily or weekly charts, as signals are stronger and less influenced by random price action. On intraday charts, reliability may decrease due to noise.

