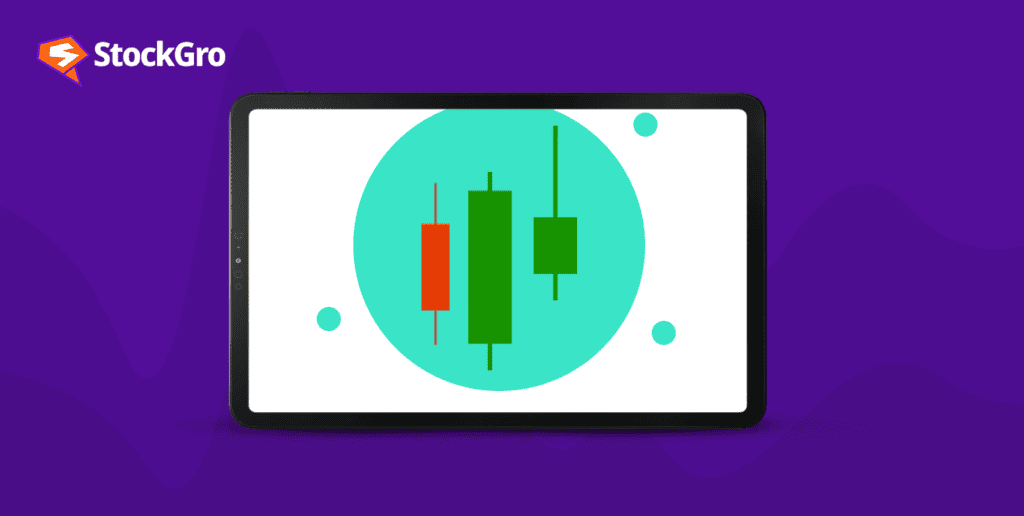
Reversal patterns are patterns that signal the inversion of a current trend in the security’s price. For instance, if a reversal pattern occurs in a bull run, it signals the coming of a bear turn, and vice versa.
In this article, we’re going to explore the 3 Outside Up reversal pattern, understand how it works, what it looks like, and how to use it in your technical analysis and trading.
You may also like: Rounding bottom pattern: How to spot and trade the bullish reversal signal
What is Three Outside Down Candlestick Pattern?
The 3 Outside Up is a bullish reversal pattern, just like the 3 Outside Down is a bearish reversal pattern. It is a simple tool to understand and use, and can be used to identify opportunities to enter long positions and profit from potential price increases.
Identifying the 3 Outside Up candlestick pattern
Here are the characteristics of the pattern that will help you identify it:
First candle:
- Bearish (closes lower than it opens)
- Represents the continuation of the downtrend
Second candle:
- Bullish (closes higher than it opens)
- Engulfs the entire body of the first candle
- This signifies a shift in momentum and the bulls gaining control
Third candle:
- Bullish (closes higher than it opens)
- Opens above the high of the second candle
- Confirms the reversal and increases the likelihood of a sustained uptrend
The significance of the 3 Outside Up pattern lies in its ability to identify potential trend reversals. The pattern suggests that the bears have lost control and the bulls are taking over, which can indicate a significant turning point in the price movement. The third candle is a confirmation, of sorts, for the indication and greatly increases confidence in the reversal signal.
Also Read: Understanding the descending triangle pattern in technical analysis
Using the 3 Outside Up pattern
The 3 Outside Up pattern can be used wherever candlestick patterns are used, which is true for most traded securities in the financial markets today.
While it is a reversal pattern, it can be used in other ways also.
As a continuation indicator
In an uptrend, the 3 Outside Up pattern can sometimes be a continuation pattern. If the second and third candles form gaps higher, it suggests that the bulls are pushing prices higher and the trend is likely to continue.
As a warning sign
In a strong uptrend, the 3 Outside Up pattern can be a warning sign of potential exhaustion. The long white candles may indicate that the market is overbought and due for a correction.
As a confirmation pattern
The 3 Outside Up pattern can be used as a confirmation signal for other technical indicators. For example, if a breakout occurs above a resistance level and is followed by a 3 Outside Up pattern, it can increase the confidence in the breakout signal.
Trading the 3 Outside Up candlestick pattern
Imagine you’re looking at the daily chart of stock A. The stock has been in a downtrend for several weeks, and you’re wondering if a potential reversal is on the horizon.
Suddenly, you see the 3 Outside Up candlestick pattern forming in the chart, with all characteristics (mentioned above) fulfilled. Here’s how you can take that trade:
- Entry: Buy ABC stock at the open of the next trading day.
- Stop-Loss: Place a stop-loss order below the low of the second candle. This will limit your potential losses if the pattern fails.
- Target: Take profit at a predetermined level. This could be a resistance level or your personal trading goal, depending on your risk tolerance and employed capital.
Note: This example is only a depiction of how this pattern could be traded. Actual results might differ a lot depending on your personal trading profile. Make sure that you’re using stop loss orders to limit potential exposure and exit the market when your goal returns have been achieved.
Also Read: The double top breakdown: Profit from chart patterns
Conclusion
The 3 Outside Up candlestick pattern is a powerful tool for identifying potential trend reversals. Just like any other indicator in technical analysis, it is far from foolproof, but it can still be a valuable addition to your trading analysis. Make sure that you use other indicators, and fundamental analysis, to back your trades for the highest success rate. Good luck!
