One main reason for trading losses is confusing minor moves with major ones. For example, a price jump without enough market participation often reverses, trapping traders. With NSE reporting daily volumes in crores, overlooking participation data can be costly. The missing tool is volume indicators, which track the weight behind market moves. They help traders separate genuine interest from hollow activity, providing context price alone cannot. In this blog, we discuss the volume indicators in detail and their benefits in detail.
What Are Volume Indicators?
Volume indicators are analytical tools that use trade volume information to assess market activity. Instead of focusing only on price, they measure how many shares, contracts, or units are being traded during a specific period. By combining price action with volume, these indicators help traders assess whether market activity is strong or weak. They are widely applied across equities, futures, commodities, and forex to study patterns, validate price direction, and monitor the intensity behind buying and selling.
Why Volume Matters in Trading
Volume shows the strength behind price activity and is closely watched for different reasons, such as:
- Higher volume with price movement indicates active participation and makes the move more reliable.
- Sudden spikes in volume often appear during breakouts or breakdowns, signaling strong interest.
- Steady volume patterns suggest continuation of market activity with consistent participation.
- Low volume with price changes may reflect weak market support, making moves less dependable.
- Comparing volume with price action helps identify whether moves are genuine or false signals.
- Liquidity in a market can also be gauged by studying trading volume, as higher activity improves ease of entry and exit.
Key Types of Volume Indicators
The main types of volume indicators are as follows:
- On-Balance Volume (OBV)
On-balance volume tracks cumulative buying and selling pressure by adding volume on up days and subtracting it on down days. The concept assumes volume comes before price, so an increasing OBV signals accumulation, while a declining OBV hints at distribution. It is often used to confirm price direction or identify divergences when OBV and price move differently.
- Chaikin Money Flow (CMF)
Chaikin money flow combines price and volume to track money inflows and outflows. It calculates how much of the trading volume occurs near the high or low of a price range. Positive CMF readings indicate accumulation (buying interest), whereas negative readings reflect distribution (selling pressure). It works well in spotting whether demand or supply is dominating during a price phase.
- Money Flow Index (MFI)
Also known as a volume-weighted relative strength index, money flow index combines price and volume to measure buying and selling pressure. It uses typical price and volume to calculate money flow, which is then compared across periods. The MFI ranges between 0 and 100, with higher readings implying strong inflows and lower ones showing outflows. Divergences between MFI and price are closely monitored for potential reversals.
- Ease of Movement (EMV)
Ease of movement links price change with volume to show how much trading activity is required for prices to move. A high positive value means prices rose with relatively low volume, signaling ease of upward movement. Conversely, negative readings imply downward movement with limited activity. This indicator is smoothed with moving averages to highlight sustained conditions.
- Accumulation/Distribution Line
The accumulation distribution line indicator measures cumulative flow of money into and out of a security. It considers the price position relative to the high-low range and multiplies it with volume. An upward-sloping line reflects accumulation, while a downward-sloping one shows distribution. Analysts often compare it with price charts to verify whether rallies are supported by strong participation.
- Klinger Volume Oscillator (KVO)
The klinger volume oscillator compares long-term and short-term volume trends by using exponential moving averages. It seeks to identify whether money is flowing into or out of a security. Positive values reflect accumulation, while negative values suggest distribution. Crossovers of the oscillator line with its signal line are often studied as shifts in participation.
- Order Flow Indicator
Unlike other volume tools, the order flow indicator examines the actual number of buy and sell orders in real time. It helps track whether buyers or sellers dominate at specific price levels. Widely used in futures and forex, it provides a more granular view of market depth and liquidity conditions, going beyond basic volume bars.
- Price Volume Trend (PVT)
Price volume trend is similar to OBV but adjusts volume in proportion to percentage price change. It adds or subtracts a portion of volume depending on whether the price moves higher or lower. This makes PVT more sensitive to both price changes and volume levels, providing a dynamic picture of whether the two are moving in harmony.
- Volume Oscillator Indicator
The volume oscillator volume oscillator examines two volume moving averages (one short-term, one long-term). The difference between the two indicates whether recent activity is stronger or weaker than usual. Positive values mean short-term volume exceeds the longer average, showing heightened interest. Negative values suggest reduced participation. It is helpful in spotting unusual spikes or declines in trading activity.
- Net Volume Indicator
The net volume indicator simply calculates the difference between up-volume (trades executed at the asking price) and down-volume (trades executed at the bid price). A positive reading reflects buying dominance, while negative values show selling pressure. It is particularly useful for intraday volume analysis where trade-by-trade details reveal short-term market bias.
How to Read & Interpret Volume Indicators
By studying price along with trading volumes indicators, you can figure out whether buyers or sellers are driving momentum. Here’s how to do it:
- Confirm trends: Strong volume during a price rise confirms bullish sentiment, while weak volume can signal an unsustainable move.
- Spot reversals: Sharp changes in volume patterns may indicate upcoming trend shifts.
- Measure participation: Volume shows how actively traders are involved, helping you distinguish between genuine moves and false signals.
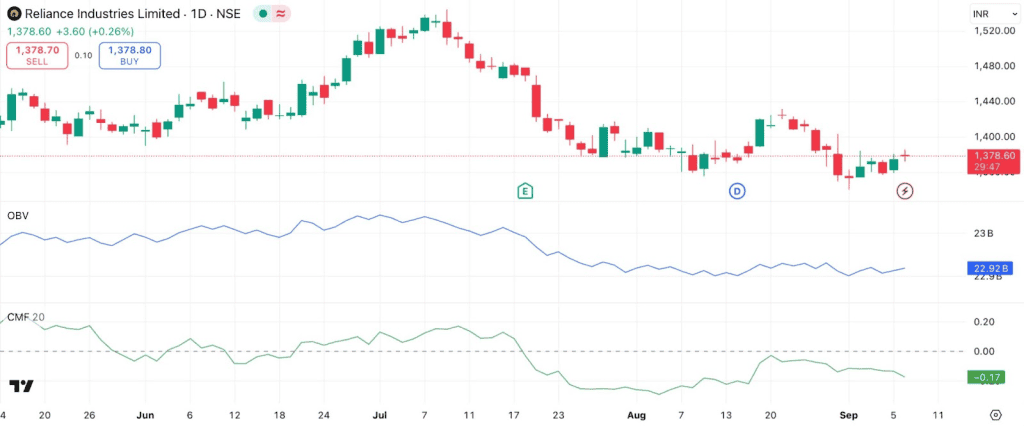
To take as an example, in the below chart of Reliance Industries Limited (₹1,378.70 as of September 8, 2025), On-Balance Volume (OBV) appears flat to slightly down, displaying muted buying interest. At the same time, the Chaikin Money Flow (CMF) is at –0.17, indicating selling pressure. Together, these signals highlight weak demand despite price stability.
Volume Indicators for Trend Confirmation
Volume is essential for validating trends and confirming price movements. The main points are as follows:
- Price and volume alignment: When prices rise alongside increasing volume, it indicates strong buying interest; similarly, falling prices on heavy volume signal genuine selling activity.
- Pullbacks during trends: Minor retracements within an uptrend accompanied by low volume suggest weak selling, while low-volume rallies in downtrends indicate limited buying pressure.
- Sustained participation: Tracking average volume over multiple sessions helps highlight consistent investor involvement and reduces noise caused by day-to-day fluctuations.
- Market involvement: High volume levels show that many participants are engaged, reducing the likelihood of manipulation or fake price moves.
- Technical confirmation: Volume combined with moving averages, trendlines, or chart patterns strengthens the reliability of trend assessment.
- Momentum validation: Strong trends are supported by rising volume, while weakening trends often display declining participation, offering early clues for trend continuation or slowdown.
Volume Indicators for Reversals & Breakouts
Volume indicators provide important signals for detecting potential reversals or breakout movements. The main aspects are as follows:
- Volume spikes at core levels: Sharp increases in volume near support or resistance indicate a breakout is more likely to hold.
- False breakout detection: Price moves without corresponding volume often fail, signaling that a breakout lacks conviction and may reverse.
- Exhaustion patterns: In uptrends, rising prices with declining volume show weakening buying pressure; in downtrends, falling prices on lower volume suggest diminishing selling interest.
- Divergence identification: Price making new highs or lows without matching volume can warn of a potential trend reversal.
- Breakout reliability: Breakouts accompanied by above-average volume are more sustainable, whereas low-volume moves are prone to failure.
- Investor sentiment: Volume patterns reflect market enthusiasm or fear, helping traders gauge overbought or oversold conditions near critical zones.
Comparing Volume vs Open Interest (Derivatives)
Volume and open interest are two core metrics in derivatives trading, each used for distinct purposes. Here’s how it differs:
| Metric focus | Volume | Open interest |
| What it measures | Number of contracts traded in a session | Total active contracts at a given time |
| Market activity insight | Captures immediate trading activity | Reflects ongoing trader participation |
| Investor sentiment | Shows short-term interest or enthusiasm | Indicates longer-term commitment |
| Confirmation of moves | Increasing volume backs price changes. | Growing open interest validates new positions |
| Warning signs | Sudden spikes may hint at reversals | Falling open interest can signal unwinding |
| Time perspective | Focused on short-term trends | Focused on long-term positioning |
Conclusion
Volume indicators open a window into market psychology, showing how money truly flows behind price action. By learning to interpret them, traders gain clarity on conviction, hidden strength, or subtle weakness that charts alone may miss. Used wisely, these tools help you cut through noise and focus on what drives markets at their core.
FAQs
Volume indicators measure the number of shares or contracts traded in a security during a specific period. They help traders gauge the strength or weakness of price movements, providing insight into market participation and momentum.
Volume indicators confirm trend strength when price movements are supported by high volume. Rising prices with increasing volume suggest strong buying interest, while falling prices with high volume indicate strong selling, validating trend sustainability.
On-Balance Volume (OBV) cumulatively adds volume on up days and subtracts on down days to show buying/selling pressure. Money Flow Index (MFI) combines price and volume data, oscillating between 0-100 to indicate overbought or oversold conditions.
Volume indicators detect market bottoms when unusually high volume occurs during price declines, signaling potential capitulation or strong buying interest, which may precede a reversal or upward trend.
Ease of Movement (EMV) measures the relationship between price change and volume to identify the ease with which price moves. Positive EMV suggests prices move easily upward, helping traders spot trends supported by low volume resistance.
A volume profile displays traded volume at specific price levels over a period, highlighting price areas with high trading activity (support/resistance zones), aiding traders in understanding market perception and potential price reactions.
Volume represents the total number of contracts or shares traded in a period. Open interest is the number of outstanding contracts yet to be closed or settled, reflecting market participants’ commitment rather than trading activity within a time frame.