
Most traders lose money not because they pick the wrong stocks, but because they act at the wrong time. Entries made on instinct, exits driven by panic. The 3 moving average crossover strategy exists to fix exactly that problem. It gives your decisions a structural backbone.
The guide below breaks down how this works, why these three specific EMAs matter, and how to actually use them on a real trade.
What is a triple moving average crossover?
The triple moving average crossover is a technical analysis strategy that places three exponential moving averages (EMAs) of different periods on a single price chart. When these averages align in a particular sequence, they generate trade signals based on the direction and strength of the prevailing trend.
The key components of this strategy are:
- Three EMAs: Different lengths of EMA – short, intermediate, and long are used.
- Exponential weighting: EMAs give higher weight to recent price data, which makes their responses faster.
- Crossover signals: When shorter EMAs cross over longer ones, trend direction may be shifting.
- Built-in trend filter: The third EMA stops you from acting on short-term noise dressed up as an opportunity.
The strategy has two straightforward signals:
- When the 9 EMA crosses above the 21 EMA, and both trade above the 55 EMA, it signals a bullish opportunity in the direction of the uptrend.
- When the 9 EMA crosses below the 21 EMA, and both trade below the 55 EMA, it indicates a potential shorting or exit opportunity in a downtrend.
Trading Strategy With Three Moving Averages
Each of the three EMAs carries a distinct function within the overall framework. Understanding what each line represents helps traders use the system more accurately, rather than treating all three lines as interchangeable.
55 Period EMA
The 55-period EMA is the pillar of this strategy. It smooths out weeks of price data and reflects where the broader trend is actually heading, not where it might be going based on a single day’s activity.
Its primary purpose is directional context. Traders use this line to determine whether it is safer to look for long entries or short ones, and it is especially valuable during volatile sessions when shorter EMAs give conflicting reads.
21 Period EMA
The 21-period EMA occupies the middle ground between the long-term trend and the immediate price action. It reacts faster than the 55 EMA but remains steady enough to avoid whipsawing with every minor price move.
In terms of use, the 21 EMA often acts as dynamic support or resistance during trending markets. When the 9 EMA crosses over it, and the 55 EMA is in the supporting direction, that crossing becomes a meaningful event rather than mere noise.
9 Period EMA
The 9-period EMA is the fastest of the three and tracks price action most closely. It reacts quickly to recent price changes, which makes it the first responder to any change in momentum. Momentum traders tend to favour this line as an early warning system for potential trend shifts.
Its primary role is to generate the initial crossover signal. When the 9 EMA moves beyond the 21 EMA, it is an alert of a shift in the momentum. However, acting on the 9 EMA alone can lead to false signals.
How to Implement the Triple Moving Average Crossover Strategy
Theory becomes useful only when it meets practice. The Coal India Ltd daily chart from mid-February through early April, 2026, walks you through every phase of this strategy in real time.
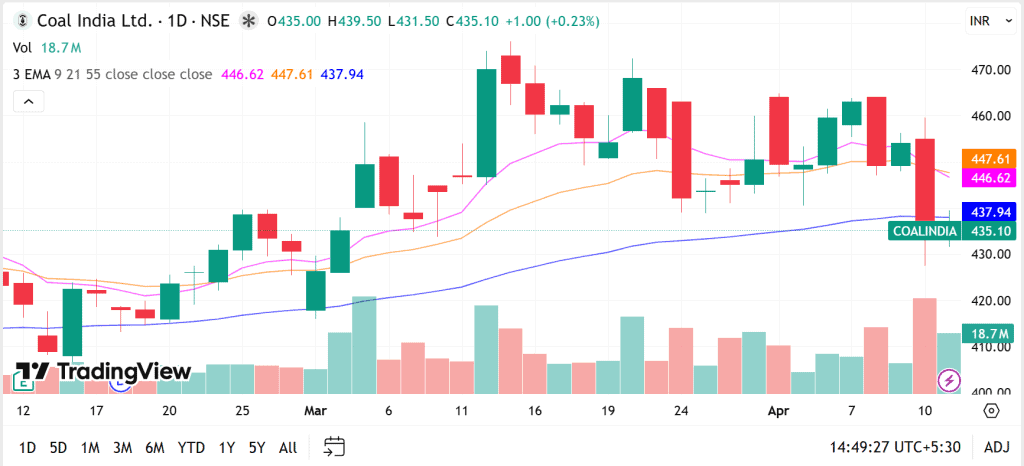
Step 1: Open and load the chart
Search NSE:COALINDIA on TradingView and set the timeframe to 1D. The chart spans mid-February to early April, covering both a trending and a reverting phase.
Step 2: Add the three EMAs
Apply three EMA overlays. On this chart, the 9 EMA plots in pink at 446.62, the 21 EMA in gold at 447.61, and the 55 EMA in blue at 437.94.
Step 3: Identify the trend context
The blue 55 EMA slopes upward from around ₹415 through mid-March. Price candles trade well above it, which indicates a clear bullish trend. Only long setups are valid here.
Step 4: Spot the crossover entry
Around late February, the 9 EMA crossed above the 21 EMA while both sat above the rising 55 EMA. The price was near ₹440. That three-line bullish alignment is your entry trigger.
Step 5: Enter the trade
Entry comes at the open of the candle after the confirmed crossover, roughly ₹438 to ₹442. Coal India then rallied toward ₹470 by mid-March, a move of nearly ₹30.
Step 6: Set your stop loss
Place the stop just below the 55 EMA, which sat near ₹420 at entry. A closing breach of that level invalidates the trade regardless of what the shorter EMAs show.
Step 7: Exit when EMAs realign bearishly
By early April, the 9 EMA crossed below the 21 EMA. Coal India closed at ₹435, beneath all three EMAs. That realignment was the exit point; holding longer would have surrendered the gains.
Advantages of the Triple Moving Average Crossover
Used with discipline, this strategy offers several significant benefits over other moving average approaches.
- Reduces Noise Effectively: Requiring alignment of all three EMAs before acting reduces the risk of acting on short-term noise. A single crossover can be a head fake. Three EMAs lining up in sequence add weight to the signal.
- Suitable for Multiple Timeframes and Markets: Whether applied on a 15-minute intraday chart or a weekly positional chart, the logic of this strategy holds. It adapts to stocks, indices, and even currency pairs or commodities.
- Simple Setup: Three lines on a chart are not complicated. The visual simplicity makes this strategy accessible to traders at various experience levels.
- Trend Alignment: The 55 EMA acts as a directional filter that stops traders from placing counter-trend trades based on emotional reasoning. This structural discipline tends to improve the risk-to-reward ratio over time.
- Easy to Pair: Combining this strategy with tools like the Relative Strength Index or On Balance Volume can improve entry quality. When other indicators support the signal, the conviction behind the move is likely stronger.
Limitations of the Triple Moving Average Crossover
No strategy is without its blind spots. Here is where the triple EMA crossover tends to struggle.
- Choppy Markets Hurt: When prices move without a directional bias, EMAs cross back and forth repeatedly, generating a string of false signals. This strategy can erode capital quickly if used without additional filters.
- Lagging In Nature: All moving averages, including EMAs, are based on historical price data. The crossover signal arrives after a move has already started. In fast-moving markets, this lag can result in entering a trade past the optimal point.
- Sensitivity to EMA Selection: Changing the EMA periods even slightly alters the behaviour of the signals meaningfully. Traders must remain consistent and avoid curve-fitting periods to match past data.
- Inactivity Is a Part of It: All three EMAs must align before a valid signal exists. There will be stretches where nothing qualifies. Forcing a trade to stay busy is how this strategy gets misused.
- No Price Targets: The triple EMA crossover tells you when to enter and when to exit, but it does not estimate how far a move may travel. How far the move might travel is another question requiring separate tools.
Conclusion
The 3 moving average crossover strategy works because it slows you down. The 9, 21, and 55 EMAs force agreement before action. Not perfect, not guaranteed, but structured. For traders who respect the rules it sets, it removes a lot of the guesswork. Beginners and seasoned traders alike can benefit from its clarity.
FAQs
There is no single best strategy. The 9, 21, and 55 EMA combination is popular because it balances short-term momentum with broader trend confirmation across different market conditions.
Use three EMAs to identify trend direction and entry points. Trade only when shorter EMAs cross and align above or below the long-term EMA, confirming strong momentum and reducing false signals.
It uses 9, 21, and 55 EMAs to identify trends. A bullish signal occurs when 9 crosses above 21, both above 55. Bearish signals are the opposite alignment.
TEMA reduces lag compared to traditional moving averages, making it useful for faster signals. However, it can generate noise in choppy markets and should be combined with other indicators.
When all three moving averages align, it signals strong trend confirmation. This alignment filters weak signals and helps traders enter trades with higher confidence in the prevailing market direction.