Uncertainty in the market is often revealed through patterns on the price chart. One such pattern is the Doji candlestick. It highlights indecision in the market and possible signs of reversal. By understanding its functioning, we can better anticipate shifts in the markets.
Let’s discover its importance, types, and limitations in this blog.
What is a Doji?
The word Doji comes from the Japanese language, meaning “the same thing”. It refers to a rare situation where the opening and closing prices are almost identical.
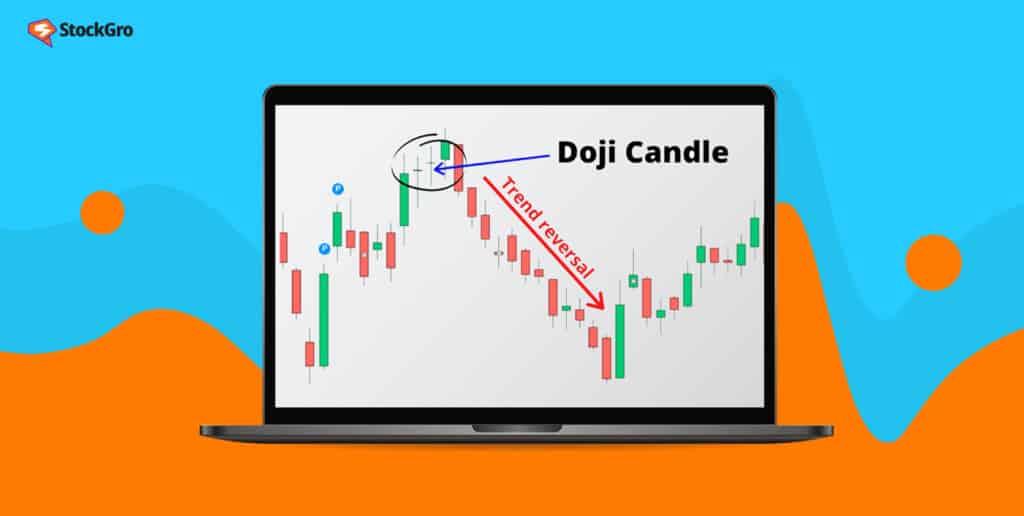
The Doji candlestick appears when an asset opens and closes at similar prices during a specified time period. As a result, the doji has a small body, looking like a plus or cross sign.
The vertical line represents the high and low of the trading session, while the thin horizontal body shows that the opening and closing prices were nearly equal.
Why are doji candles important?
The doji candles are important because of the following reasons:
- Signals Market indecision
The Doji appears when buying and selling pressure is equal. It shows hesitation from both ends, indicating neither has control over the price direction. - Possible Trend Reversal
When a Doji forms after the end of a trend, it signals the loss of momentum. Traders interpret this as an early sign of a possible reversal. - Acts as a Confirmation Trigger
Although it does not confirm the trend, the Doji acts as an early warning. The follow-up candle is watched to confirm the shift in trend. - Reflects Market Psychology
The Doji represents the struggle between buyers and sellers. Understanding the tension among them helps in making more informed and disciplined trading decisions.
Types of Doji
Different types of Doji candles reflect different forms of market indecision. Let’s understand each type of doji candlestick pattern one by one.
Dragonfly Doji Candle
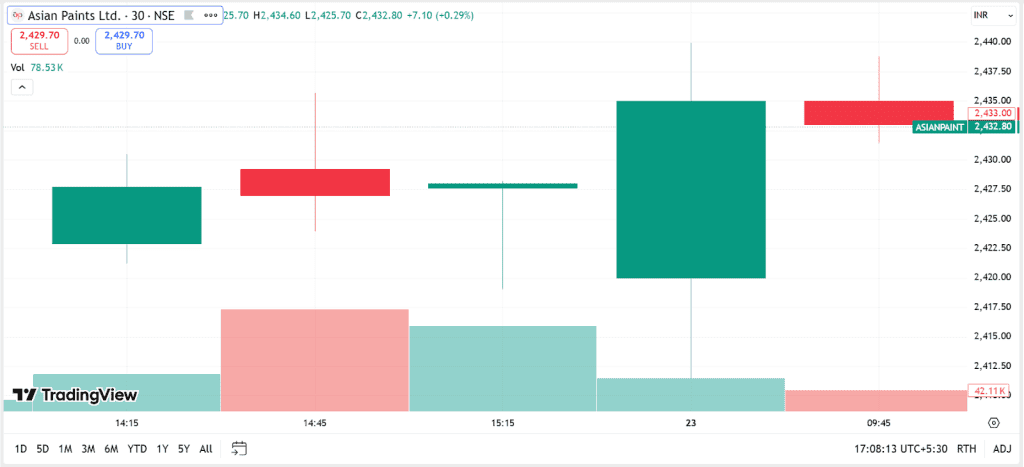
The Dragonfly Doji Candle appears when the opening and closing prices are close to the session’s high, with a long lower wick and little to no upper shadow.
It shows that although sellers pushed the price lower, the buyers regained control and moved it higher. The Dragonfly Doji hints at a bullish reversal.
Example: A dragonfly doji is visible on Asian Paint’s around 15:15 mark on the 30-minute chart on February 20, 2026.
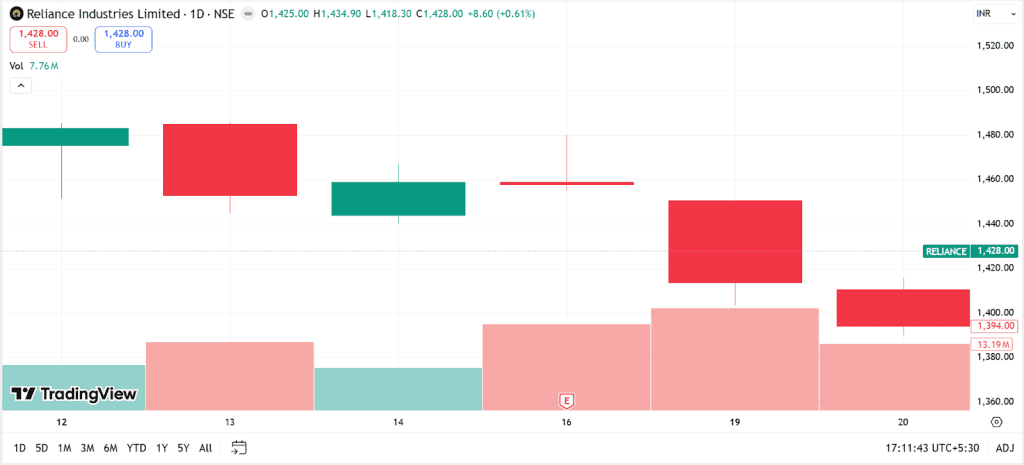
Gravestone Doji Candle
When the opening and closing prices are near the session low, accompanied by a long upper wick, a Gravestone Doji candle is deformed.
It suggests that buyers tried to push prices higher, but sellers stepped in and brought the price down. The Gravestone Doji reflects a bearish reversal.
Example: Reliance Industries formed a gravestone doji candlestick on January 16, 2026.
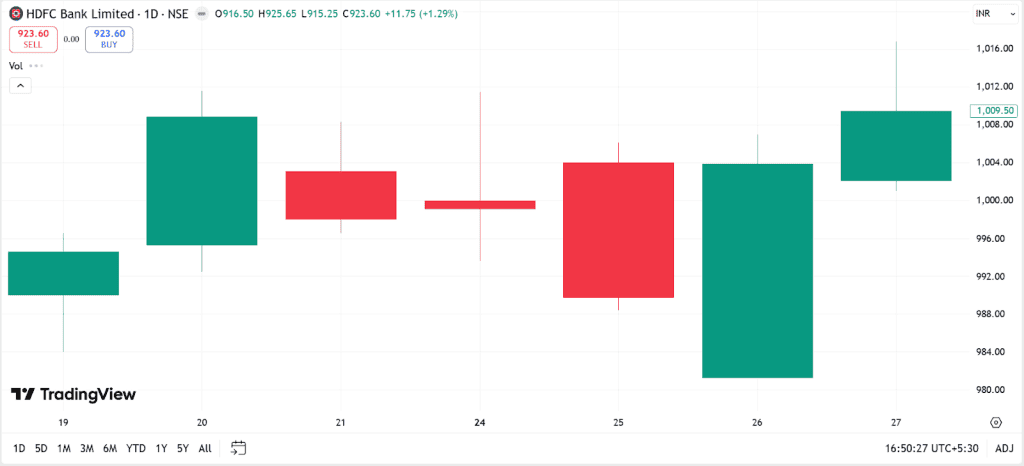
Long-Legged Doji Candle
The Long-Legged Doji has a small body compressed between long upper and lower shadows. This candle reflects high volatility.
The back and forth between buyers and sellers indicates the intense struggle before a breakout or reversal.
Example: The following chart shows a long-legged doji in HDFC Bank’s price movement on November 24, 2025.
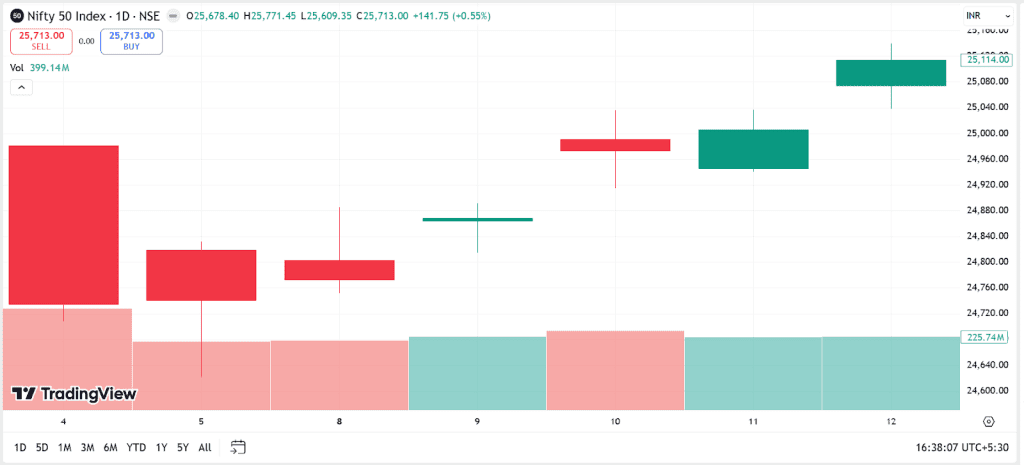
Hammer Doji
The Hammer Doji has a long lower shadow and a small body near the top. It shows rejection of the lower prices and possible shift towards a bullish momentum.
Example: On September 9, 2026, a hammer doji was visible in the Nifty 50 chart.
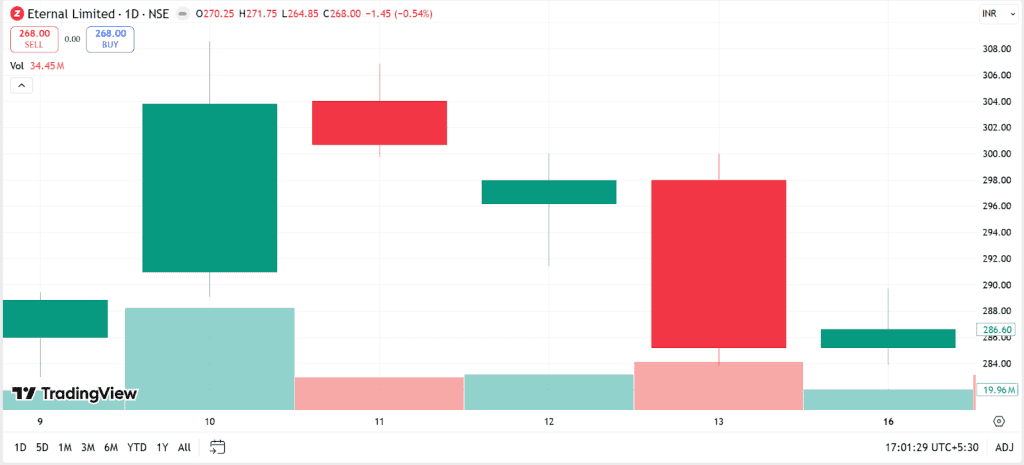
Star Doji
A Star Doji forms when a Doji candle appears with a gap above or below the previous candle. It has a small or no body with two long wicks, creating the “star” like structure.
Example: On February 12, 2026, a clear Star Doji was observed in the stock price of Eternal Ltd., the parent company of Zomato.
Is a Doji Bullish or Bearish?
A Doji is neither inherently bullish nor bearish. Its meaning depends on context.
- If it appears during or after an uptrend, it means that buyers are fading and a bearish reversal is likely to follow.
- If the Doji forms after or during a downtrend, it hints at a bullish reversal and the sellers losing control.
What Is the Difference Between a Doji and a Spinning Top?
A Doji differs from a spinning top in these aspects:
| Basis | Doji | Spinning Top |
| Body Size | Extremely small or nearly invisible | Small but clearly visible |
| Open & Close Price | Almost identical | Close but not equal |
| Appearance | Looks like a cross or plus sign | Small body with upper and lower shadows |
| Market Indecision | High level of indecision | Moderate indecision |
| Signal Strength | The signals are stronger | Weaker compared to Doji |
| Psychology | Perfect balance between buyers and sellers | Slight dominance by one side but still uncertain |
Limitations of a Doji
While the Doji candlestick pattern is useful, it has certain limitations:
- Not a Standalone Signal: The Doji requires confirmation from the next candle. It can’t be used for trading signals alone.
- False Signals: When the markets are volatile, the Doji can create false or misleading signals. This can trap the traders in unfavourable positions.
- No Directional Bias: The Doji is neutral. It does not show where the market is headed next; it only reflects a brief pause in the momentum without providing any directional cues.
- Inconsistency: In shorter timeframes, the Doji may give out frequent false signals, while in longer charts like daily or weekly, it generates more reliable signals. This makes the Doji less versatile.
Conclusion
The Doji candlestick pattern reflects market indecision. By understanding that neither the buyer and sellers are in control, you can take a step back and implement a more holistic approach to your trading strategy.
With the knowledge of Doji’s significance and types, you can make more information-driven decisions rather than relying on your intuition and judgement.