Analysis of the stock market pattern is an essential skill every trader and investor should have today as it helps them to make well-informed decisions.
The two types of stock market analysis are – fundamental & technical analysis.
Fundamental analysis deals with analysing stock prices based on fundamental factors such as economic conditions, the company’s performance – the balance sheet, profit/loss statement, assets and liabilities. At the same time, technical analysis uses statistical trends to understand the historical price movement of the stock.
Understanding the basics of candlestick charts
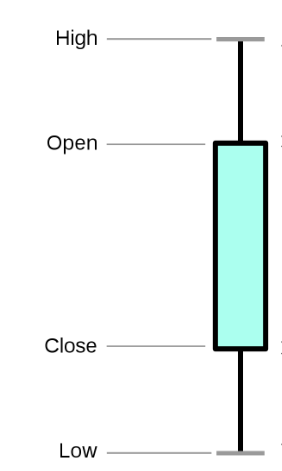
A candlestick chart comprises multiple candlesticks determining different price movements of a stock during a particular time period.
A candlestick pattern is made of a rectangle called the body and two lines on either end of the rectangle called the wick/shadow of the candle.
Here, the body represents the stock’s closing and opening price. Next, the upper and lower wicks show the stock’s highest and lowest price, respectively.
Inverted hammer candlestick pattern
An inverted hammer candlestick gets its name from the shape – it looks like a hammer that’s kept upside down.
The inverted hammer candlestick indicates a possible price reversal, suggesting a bullish uptrend in the market.
This is found at the bottom of the chart, indicating that the price of the stock has reached its lowest point and is likely to take off from here.
You may also like: Insights into market trends and reversals using Inverted Hammer
Features of an inverted hammer candlestick
– The opening and closing prices of the stock are very close to each other.
– The stock’s highest price, represented by the top wick, is at least double the size of the candle’s body.
– There is usually no wick at the bottom, which means the opening/closing price is also the stock’s lowest price during that period.
What does a green inverted hammer candlestick mean?
The green candlestick indicates that the stock’s closing price was more than its opening price, signalling strong bullish momentum.
Here, the stock’s opening price is the same as its lowest.
This indicates a situation where the bulls and bears try to influence the stock price, with bulls overtaking and closing the stock at a price slightly higher than the opening price.
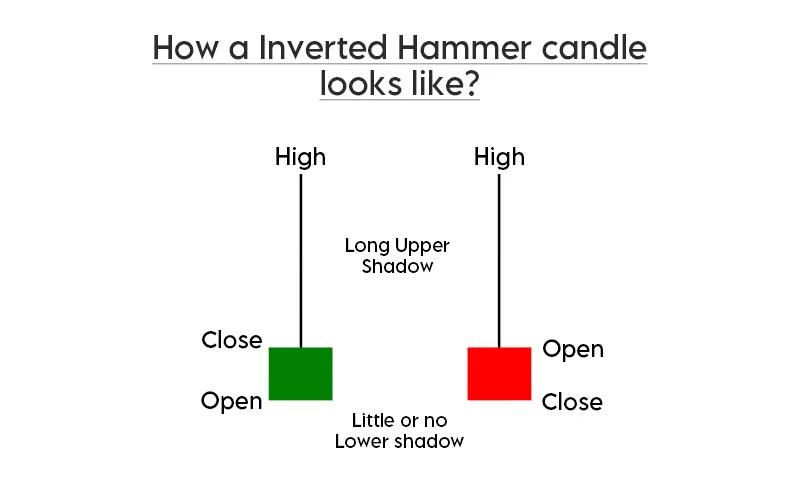
What does a red inverted hammer candlestick mean?
The red candlestick suggests that the stock opened higher and closed lower.
Here, the closing price of the stock is also the lowest price of the stock.
Since the stock’s closing price is lower, this may feel like a bearish pattern. However, this is a bullish pattern too but less bullish as compared to the green candlestick.
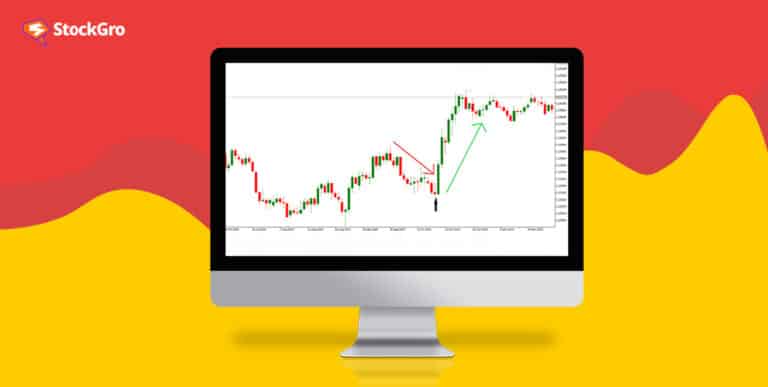
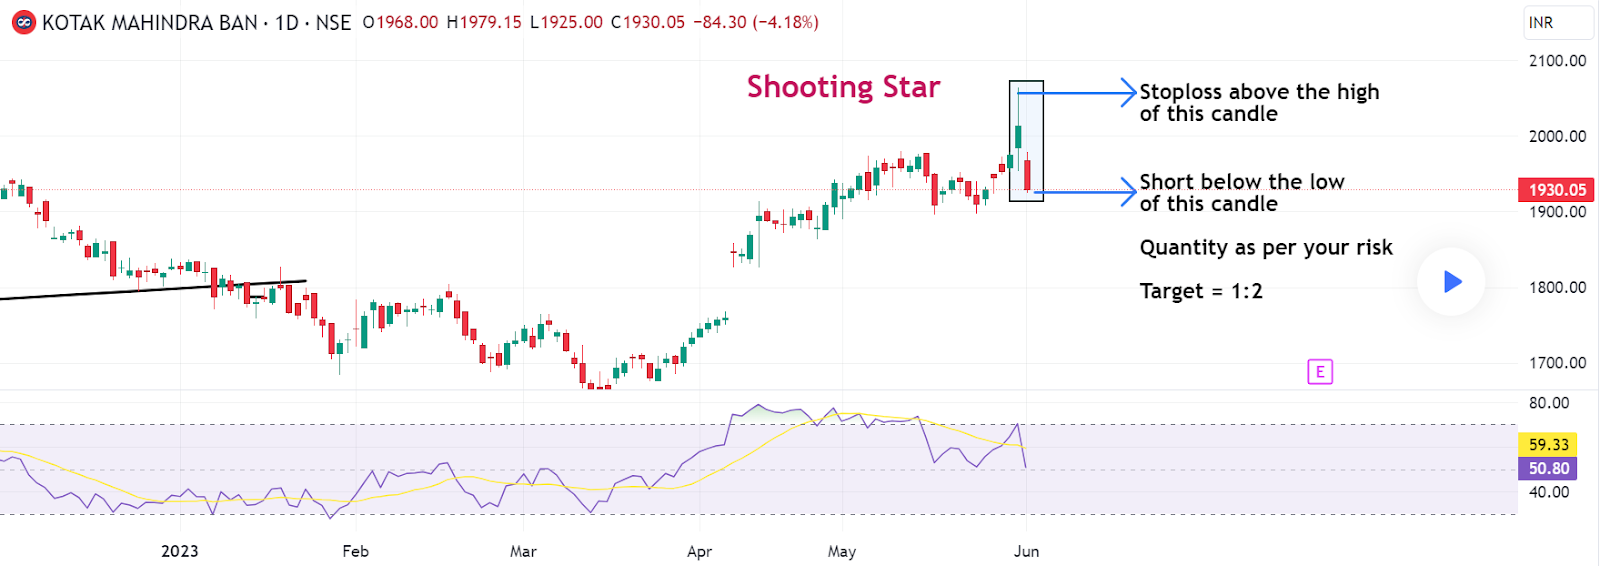
Shooting star candlestick pattern
In the inverted hammer vs. shooting star pattern, both are very similar looking candlesticks with their main differentiator being their positions in the candlestick chart.
In the equity market, the shooting star is typically found at the peak of a candlestick chart, signalling a potential shift from a rising (bullish) trend to a falling (bearish) trend.
Also Read: How do traders harness the power of Hammer Candlestick patterns?
Here’s how it works.
After several rising price candles (uptrend), a special candle forms – this is the shooting star.
The shooting star starts strong and rises, but by the end, sellers push it down to near where it started.
This suggests that buyers are losing steam, and sellers might take over.
The next candle is important. If it drops a lot, especially with a lot of trading volume, it confirms the shooting star’s warning: prices might keep dropping.
But if prices rise after a shooting star, either the warning was wrong, or prices are just facing a temporary pause. This means the area of the shooting star could become a tough spot for prices to pass in the future.
Hence, this pattern suggests prices might drop soon. But always watch the next candle to be sure. If prices rise instead, it might just be a brief pause, or the warning might’ve been false.
The features of a shooting star candlestick are like that of the inverted hammer in terms of how the opening, closing, highest and lowest prices are positioned.
Green and red shooting star candlesticks
The red candlestick denotes a bearish trend as the stock price closed lower than it opened.
On the other hand, the green candlestick indicates a situation where the closing price is higher than the opening price, which is also a bearish trend, but less strong in comparison to the red candlestick.
Difference between shooting star and inverted hammer
– The inverted hammer candlestick represents an upward trend, whereas the shooting star represents a decline.
– In inverted hammer vs shooting star, first is generally found at the bottom of the candlestick chart and the latter is found at the top of the chart.
– Though both indicate price reversal trends, the inverted hammer represents an upward trend in the price of stocks whereas the shooting star represents a downward trend in stock price.
| Inverted hammer vs shooting star | ||
| Feature/Pattern | Inverted Hammer | Shooting Star |
| Trend Indication | Bullish | Bearish |
| Chart Position | Bottom of the chart | Top of the chart |
| Price Reversal | Upward trend | Downward trend |
Bottomline
In inverted hammer vs shooting star, both are considered important for analysing stock market trends.
However, these are mostly warnings of how prices may vary and not assured signs which indicate future price movements. Hence, traders should always consider other technical aspects along with these before making any buying or selling decisions.
FAQs
1. Are shooting star and inverted hammer the same?
No, they are not the same. A shooting star occurs after an uptrend and signals a potential reversal to the downside, while an inverted hammer appears after a downtrend and suggests a potential bullish reversal.
2. Can a shooting star be bullish?
A shooting star is generally bearish, signaling a possible reversal of an uptrend. However, if it occurs at a key support level or is followed by strong buying, it could be seen as a sign of strength and not a full reversal.
3. Which is stronger, a hammer or an inverted hammer?
Both hammer and inverted hammer are reversal patterns, but the inverted hammer is often considered slightly stronger when it forms after a downtrend because it shows a failed attempt to push the price lower, signaling potential bullish momentum.
4. Can an inverted hammer be bullish?
Yes, an inverted hammer is typically a bullish pattern, indicating that buyers are beginning to take control after a downtrend. Confirmation with a subsequent rise in price is needed to validate the pattern.