Markets don’t move in straight lines. They expand and contract in ways that most traders never fully account for. Most beginners focus only on the price direction, but fail to account for the invisible rhythm beneath it. The ATR indicator reads that rhythm. It does not shout direction. It whispers magnitude. And that whisper, used well, can sharpen every decision you make. This guide walks you through how to use ATR in intraday trading, along with its formula and real applications.
What is the ATR Indicator
The Average True Range (ATR) was developed by J. Welles Wilder Jr. in 1978. It measures volatility by averaging the price range over a set number of periods.
ATR does not tell the direction of movement. What it tells you is how far it is likely to move. Understanding this is crucial for intraday trading.
ATR Indicator Formula
True Range (TR) is the maximum of (Current High − Current Low), |Current High − Previous Close|, |Current Low − Previous Close|
ATR = Moving Average of TR over n periods (default: 14)
Example:
Suppose a stock has a High of ₹1,520, a Low of ₹1,490, and the previous day’s Close was ₹1,505.
TR values:
High − Low = ₹30
|High − Prev Close| = ₹15
|Low − Prev Close| = ₹15
True Range = ₹30
Average TR over 14 sessions = ₹28 → ATR = 28. It means the stock moves roughly ₹28 in a typical session.
How to Use ATR in Intraday Trading
For intraday trading, ATR can be used in several practical ways.
- Dynamic Stop Losses: ATR removes guesswork from stop placement. Instead of a fixed ₹50 stop, traders use multiples of ATR, typically 1x or 1.5x, to let the trade breathe without undue risk.
- Filtering High Volatility Stocks: A high ATR value relative to the stock’s price signals wider swings. Traders seek such stocks for momentum plays and avoid them when the goal is controlled scalping.
- Sizing Positions: ATR helps normalise position size across different stocks. Higher ATR means higher per-trade risk, which means fewer shares to stay within a fixed capital risk limit.
- Confirming Breakouts: A breakout accompanied by an ATR spike carries conviction. One that happens on a flat ATR is often a fakeout. ATR adds the volume of intent that price alone cannot show.
How ATR Works in Intraday Trading
ATR is not a switch you flip. It is a lens. In intraday trading, it works by quantifying how much the market is stretching on any given session, and that information feeds into virtually every risk-related decision a disciplined trader makes.
Setting Stop Loss Using ATR
A stop loss is the boundary that separates a managed loss from a catastrophic one. Without a logical basis for placing it, traders either set it too tight and get stopped out by noise, or too wide and absorb unnecessary damage.
When combined with ATR, the stop loss strategy becomes adaptive. You take your entry price and subtract a multiple of the current ATR. This way, the stop adjusts with the market conditions.
Example: Say you buy a stock at ₹1,800 and the 14-period ATR on a 15-minute chart is ₹22. Using a 1.5x multiplier, your stop sits at ₹1,800 − (₹22 × 1.5) = ₹1,767. Only a genuine adverse move beyond ₹33 would exit the trade.
Position Sizing with ATR
Position sizing is not about how many shares look impressive. It is about how many shares you can hold without your capital risk exceeding what you planned for. ATR gives you the data to calculate that precisely.
You define the maximum capital you are willing to lose on a single trade. You then divide that rupee risk by the ATR-based stop distance. This ties every trade to the same risk framework, regardless of the stock’s absolute price.
Example: Assume your total capital is ₹5,00,000 and you risk 1%, meaning ₹5,000 per trade. You want to buy a trending share, and the ATR stop distance is ₹50 per share.
Shares to buy = ₹5,000 / ₹50 = 100 shares.
Identifying Volatile Stocks Using ATR
Not every stock is worth trading intraday. ATR helps filter the universe quickly, surfacing stocks where real price movement is happening.
The approach is comparative. You look at ATR as a percentage of the stock’s price, sometimes called the ATR percentage or normalised ATR.
Example: A stock priced at ₹500 with an ATR of ₹25 has a 5% daily range, which is active. A stock at ₹3,000 with an ATR of ₹30 has only a 1% range, which is relatively quiet. Identifying volatile stocks using ATR becomes a pre-market screening habit for seasoned traders.
ATR for Breakout Confirmation
Breakouts are tempting, but not every breach means the move will follow through. Many are traps. ATR adds a layer of confirmation that price action alone cannot always provide.
When a stock breaks through a key level and the ATR expands above its recent average, it signals that participants are committing to the move.
Example: Imagine a stock is consolidating between ₹1,140 and ₹1,155 for 45 minutes. ATR on the 5-minute chart has been flat at ₹4. Then the stock breaks ₹1,155, and ATR jumps to ₹7 within two candles. That surge signals real momentum. A trader entering on that expansion has a more reliable breakout.
Best ATR Settings for Intraday
Period: The standard 14-period ATR works well on most intraday timeframes. Scalpers often reduce it to 7 or 9 for faster responsiveness, while swing traders may stretch it to 20.
- Timeframe: For intraday, the 5-minute chart is the most common one. The 15-minute chart suits traders who prefer fewer signals with higher quality. 1-minute ATR is too rapid for most traders.
- Stop Loss Multiplier: 1x ATR suits aggressive scalpers. 1.5x is the intraday standard. 2x ATR works for wider-range trades or high-volatility sessions like Budget day or earnings releases.
- Smoothing Method: Most platforms use the Relative Smoothing Method (RMA) by default, which is what Wilder intended. EMA-based ATR is slightly more reactive but produces similar results on intraday charts.
- Stock Type: Large-cap stocks generally show lower ATR values. Mid and small caps exhibit wider ATR ranges and require adjusted multipliers to avoid oversized stops or too-tight entries.
ATR vs RSI vs MACD Comparison
Each indicator answers a different question. ATR answers how much; RSI answers how stretched; MACD answers which direction with what momentum. Here is a comparison between the three:
| Parameter | ATR | RSI | MACD |
| Purpose | Measures volatility | Measures overbought and oversold conditions | Measures momentum & trend |
| Directional | Does not tell the direction | Partial (signals extremes) | Yes (crossovers signal bias) |
| Best Use | Stop loss, position sizing | Reversal signals, divergences | Trend entry confirmation |
| Intraday Relevance | Very High | High | Moderate to High |
| Lagging | Yes (smoothed average) | Less lagging | Moderate lag |
| Used Alone | Rarely effective alone | Often combined | Often combined |
Common Mistakes While Using ATR
ATR is precise in what it measures, but easily misread in how it is applied. Traders who understand the formula often still make errors in execution.
- Treating ATR as a Signal: ATR measures volatility, not direction. Using a rising ATR alone to enter a trade ignores the fact that high volatility can accompany both rallies and crashes.
- Same Multiplier for Every Stock: A 1.5x ATR stop on a low-volatility pharma stock and a high-beta mid-cap will produce very different results. Calibrate per instrument based on historical behaviour.
- Ignoring Timeframe: Applying a daily ATR to a 5-minute chart trade produces stops that are too wide and targets that are unrealistic for the session. Always use ATR from the same chart you are trading.
- Overloading: Pairing ATR with RSI, MACD, and Bollinger Bands simultaneously creates conflicting signals. ATR works best as a risk tool layered simply over a directional indicator.
- Not Recalculating After Volatile Events: Corporate earnings, SEBI announcements, or RBI rate decisions cause ATR to spike. Using yesterday’s ATR in the morning after a major news event can cause dramatically undersized stops.
Practical Intraday Example Using ATR
Let’s understand an intraday setup using ATR with NTPC Green Energy’s 15-minute chart on April 13, 2026.
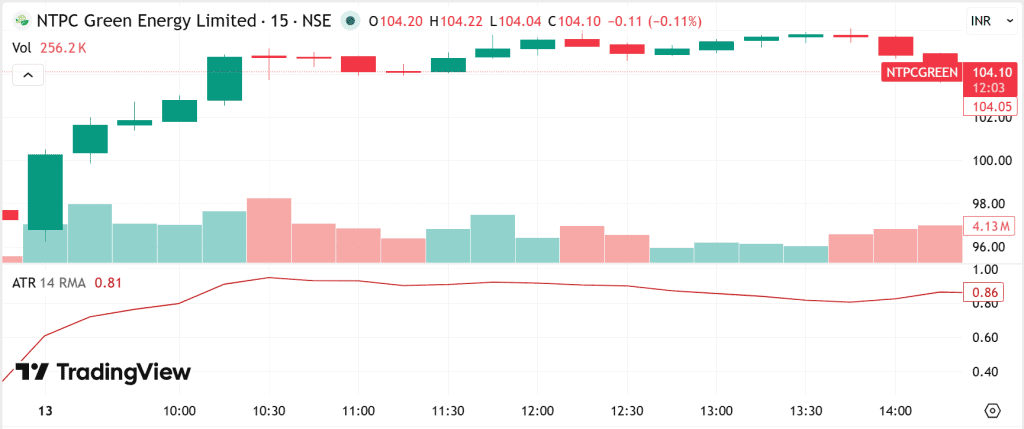
Step 1: Load the chart and read the ATR
Open NTPCGREEN on a 15-minute chart and add ATR(14 RMA). The day opens with a strong green candle and high volume. ATR is climbing from below 0.60, telling you volatility is building from the first candle itself.
Step 2: Identify the setup
Between 9:15 and 10:00 AM, the stock pushes steadily from around ₹97 toward ₹104. Each candle is green, volume is present, and ATR is rising with price.
Step 3: Confirm with ATR expansion
By 10:30 AM, ATR peaks near 1.00 — its highest point of the session. That expansion alongside rising prices confirms genuine buying conviction. This is your signal that the move has real participation behind it.
Step 4: Place your stop loss
You enter at ₹104.20 as the ATR reads 0.90.
Using 1.5x multiplier: Stop = ₹104.20 − (₹0.90 × 1.5) = ₹104.20 − ₹1.35 = ₹102.85. The stock has room to breathe without stopping you out on normal noise.
Step 5: Size your position
Assume the trading capital ₹5,00,000 and risk 1% = ₹5,000.
Stop distance = ₹1.35. Shares = ₹5,000 / ₹1.35 ≈ 3,700 shares.
Step 6: Set your target
Using 2x ATR from entry: Target = ₹104.20 + (₹0.90 × 2) = ₹104.20 + ₹1.80 = ₹106.00.
Step 7: Monitor and exit
Price consolidates from 11:00 AM onward, ATR contracts to 0.81. No fresh momentum. You exit at ₹105.50, making ₹1.30 per share, roughly ₹4,800 on the trade against a planned risk of ₹5,000.
Conclusion
ATR is not flashy. It does not predict the next big move or show green arrows on your chart. What it does is bring structure to the chaotic world of intraday trading: consistent stop placement, proportional position sizing, and cleaner entry filters. Used alongside basic technical analysis and market awareness, it reduces the emotional variables that cost most intraday traders more than any single bad trade ever does.
FAQ‘s
The standard 14-period ATR works well for most traders. Scalpers may use 7–9 for faster signals, while longer settings give cleaner, more reliable setups.
No, ATR does not predict direction. It only measures volatility, showing how much a stock may move, not whether it will go up or down.
ATR helps place dynamic stop losses based on volatility. Using 1x or 1.5x ATR ensures stops are neither too tight nor too wide for market conditions.
Yes, ATR can be useful for scalping when used with shorter periods. It helps identify quick volatility changes and set precise stop losses for fast trades.