Every morning, thousands of traders stare at the same price chart and walk away with completely different results. The difference often comes down to one thing: which reference levels they trust. Pivot points have quietly become the backbone of trade setups globally. Yet most traders never stop to ask if they are using the right type. This guide walks you through what pivot points are and how the different types work.
What Are Pivot Points in Trading
A pivot point is a price level used to determine probable support and resistance for the current day. It is calculated from the previous session’s high, low, and close.
Think of them as the market’s overnight homework. Before a single candle appears, pivot point trading already has a framework on the chart.
Formula: Pivot Point = (High + Low + Close) / 3
From this central level, additional price levels are calculated. It gives traders a pre-built map of where price is likely to pause, reverse, or accelerate. These additional bands are:
Resistance 1 (R1) = (P*2) – Low
Support 1 (S1) = (P*2) – High
Resistance 2 (R2) = P + (High – Low)
Support 2 (S2) = P – (High – Low)
Resistance 3 (R3) = High + 2 * (P – Low)
Support 3 (S3) = Low – 2 * (High – P)
Pivot levels are static once the session opens. That fixed quality is precisely why floor traders leaned on them long before retail charting platforms existed.
Which Pivot Points Are Best for Intraday Trading
No single pivot type wins across all conditions. The right choice depends on how you trade and how much volatility you can absorb. Here is a simple breakdown by trader profile:
- Beginners: Classic Pivot Points. Widely used, well-documented, and the price actually reacts to these levels because so many participants watch them.
- Scalping: Camarilla Pivot Points. Tighter level spacing suits fast trades on 5-minute charts where every rupee of precision counts.
- Trending market: Fibonacci Pivot Points. Levels align with natural retracement zones, making them useful when a stock is clearly moving in one direction.
- Recency-focused trader: Woodie’s Pivot Points. The formula weighs the closing price more heavily, so levels shift closer to where the price actually settled.
Types of Pivot Points
Each system uses a slightly different formula, placing support and resistance at different distances from the central pivot. Here is what separates them.
Classic Pivot Points
They use the standard formula discussed earlier. The resistance and support levels fan out from the midpoint. They are a natural first tool for anyone new to structured analysis.
Their edge is collective attention. When enough participants plot the same levels, the price genuinely tends to react there. That makes pivot point trading with the Classic system self-reinforcing in liquid markets.
Fibonacci Pivot Points
Same central pivot, different level spacing. Fibonacci ratios of 38.2%, 61.8%, and 100% are applied to the prior session’s range to set the bands. The result leans toward momentum-driven price action.
The Fibonacci trading strategy works well when a stock pulls back before resuming its direction. The levels double as retracement guides, adding a second layer of confirmation.
Camarilla Pivot Points
They were developed in 1989. Camarilla pivot points compress all levels tightly around the previous close, producing four bands above (H1 to H4) and four below (L1 to L4). H3 and L3 are reversal zones; H4 and L4 signal breakout territory.
For traders who want precision over breadth, this is the sharpest tool. Range-bound sessions are where Camarilla tends to outperform the wider-spaced alternatives.
Woodie’s Pivot Points
They use a different formula: PP = (High + Low + 2 x Close) / 4. The double weighting on the close means the pivot reflects recent sentiment more than historical range extremes.
Traders who find Classic pivots slightly removed from where price actually trades often prefer Woodie’s. When a session’s range was dominated by a late directional move, Woodie’s pivot tends to sit closer to where the real action was.
Which Pivot Point Works Best for Intraday
After comparing all four systems, here is a practical verdict for intraday trading:
- Classic Pivot Points are best for beginners and for liquid large-cap stocks like Nifty 50 constituents. Widespread usage creates genuine price reactions at these levels.
- Camarilla Pivot Points suit experienced scalpers who trade in tight windows. The narrow H3/L3 levels are precision tools for 5- to 15-minute charts.
- Fibonacci Pivot Points work well in trending markets where momentum stocks pull back before continuing. Best used alongside volume confirmation.
- Woodie’s Pivot Points appeal to traders who want recency bias in their reference levels. Useful when the previous day’s range was dominated by a single directional move.
For most Indian retail traders, starting with Classic Pivots and then layering Camarilla levels for precise entries gives a well-rounded intraday approach.
Pivot Points with Other Indicators
Pivot levels mark where the price might react. Technical indicators tell you whether that reaction is worth trading. These three naturally pair with pivot-based setups.
Moving Average (MA)
Moving average smooths price data over a set period to reveal the underlying trend. It filters out the market noise and gives direction context that pivot levels alone cannot provide.
You can plot a 21-period Exponential Moving Average (EMA) alongside your pivot levels. A bounce from S1 while price sits above the EMA favours a long. A rejection at R1 below the EMA tilts the bias short.
Relative Strength Index (RSI)
The RSI measures momentum on a scale of 0 to 100. Readings below 30 suggest oversold conditions, above 70 indicate overbought. It adds a speed check to pivot-based entries.
When RSI reads below 30 near an S1 or S2 level, the probability of a bounce rises. A divergence between RSI and the resistance pivot signals exhaustion of a move before a reversal.
Fibonacci Retracement
Fibonacci retracement maps horizontal levels at key ratios of a prior price move. It identifies where pullbacks commonly stall.
Draw the retracement from the prior day’s swing low to high. When the 61.8% level sits directly on a pivot support, that confluence becomes a high-conviction entry zone that many institutions also monitor.
How to Use Pivot Points in Intraday
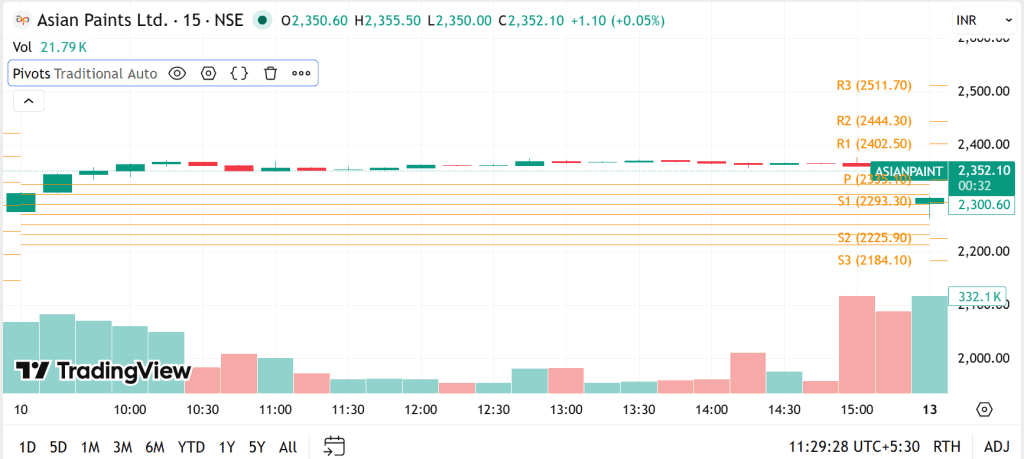
The chart below shows Asian Paints on NSE on April 10, 2026, plotted on a 15-minute timeframe.
Step 1: Mark the levels
The pivot (P) sits at ₹2,335.10. R1 at ₹2,402.50 and S1 at ₹2,293.30 are your primary session boundaries. Note these before price moves.
Step 2: Read where the price opens
The stock opens at ₹2,350.60, clearly above the pivot of ₹2,335.10. That gap above P at the open signals a mild bullish tilt for the morning session.
Step 3: Watch for a test of the pivot
Notice how the price drifts back toward the P level around mid-morning. This is the market testing whether the pivot holds as support. Wait for a candle to close above P before acting.
Step 4: Check the volume
The volume panel shows a surge around 15:00. A pivot level tested on rising volume is far more trustworthy than a quiet drift into the same zone.
Step 5: Define your trade
If you enter long near P at ₹2,335, set a stop below S1 at ₹2,293.30. The first logical target is R1 at ₹2,402.50. It is offering a considerable risk-to-reward ratio.
Step 6: Manage through the session
As the session progresses, trail the stop up toward P once price moves convincingly above it. If price stalls between P and R1 without a volume push, that is a signal to tighten.
Step 7: Exit and record
Book the trade at or near R1. The current price on the chart of ₹2,352.10 shows the stock still trading above P, which confirms the pivot held through the session. Log how the level reacted for reference in tomorrow’s setup.
Common Mistakes While Using Pivot Points
Most pivot trades are lost not at the level but in the decisions made around it. Here is what to avoid.
- Trading Without Context: A bounce at S1 in a broader downtrend is far more likely to fail than one in an uptrend. Pivot levels do not override market direction.
- Skipping Volume Confirmation: Price touching a pivot level without volume behind it rarely holds. A high-volume reaction carries significantly more weight than a quiet drift to the same level.
- Stacking Multiple Pivots: Running Classic, Camarilla, and Woodie’s on the same chart simultaneously creates clutter. Pick one system per session and stick to it.
- Exact Stop-Loss: Markets routinely sweep just below a support level before reversing. Place stops a few points beyond the pivot, not directly at it.
- Discounting Overnight Gaps: A stock opening far above or below the prior range weakens pivot reliability in the first 30 minutes. Let price settle before acting on those levels.
Best Timeframe for Pivot Point Trading
Timeframe is not a minor detail. It shapes everything from how clearly levels appear to how often false signals show up.
The 15-minute chart suits most intraday pivot strategies. It captures enough price structure to identify setups without drowning in noise. Scalpers working faster will find the 5-minute chart more responsive.
For longer holdings across two to three hours, the 30-minute chart slows things down usefully. Levels are cleaner, and decisions feel less rushed.
Pick the timeframe that matches your actual holding period. Forcing a shorter timeframe mindset onto a longer chart or vice versa is where the confusion begins.
Conclusion
Pivot points work because collective attention creates genuine price reactions at shared levels. The type you choose should match how you actually trade. Classic Pivots offer the broadest applicability; Camarilla sharpens precision; Fibonacci and Woodie’s serve specific conditions. Consistency in applying one system well beats switching between four systems poorly.
FAQ‘s
Pivot points are not exact predictions. They show possible price levels. Accuracy improves when combined with indicators like moving averages or RSI, rather than using them alone.
Camarilla pivot points are best for scalping. Their close and tight levels help traders enter and exit quickly during short trades on lower timeframes.
Yes, pivot points work well in Nifty. Due to high trading volume and participation, prices often react at these levels, making them useful for intraday traders.
Yes, but it is not recommended. Using pivot points with indicators like RSI or moving averages gives better results and helps confirm trade decisions.