
In a pharmaceutical world shaped by patent cliffs, pricing pressures, and regulatory scrutiny, scale and diversification matter more than ever. Dr. Reddy’s Laboratories Ltd has steadily transformed itself from a pure-play generics exporter into a diversified global pharma company with strengths across US generics, emerging markets, APIs, and biosimilars.
As the industry moves toward specialty therapies and complex generics, Dr. Reddy’s stands at a crucial point, balancing cash-generating legacy businesses with innovation-led growth platforms.
But does Dr Reddy’s Laboratories Ltd. offer a compelling case for long-term investors? Let’s delve deeper.
Stock overview
| Ticker | DRREDDY |
| Industry/Sector | Healthcare & Pharma |
| CMP | 1277.80 |
| Market Cap (₹ Cr.) | 1,06,649 |
| P/E | 19.35 (Vs Industry P/E of 31.82) |
| 52 W High/Low | 1379.70 / 1020.00 |
| EPS (TTM) | 66.17 |
| Dividend Yield | 0.62% |
About Dr Reddy’s Laboratories Ltd.
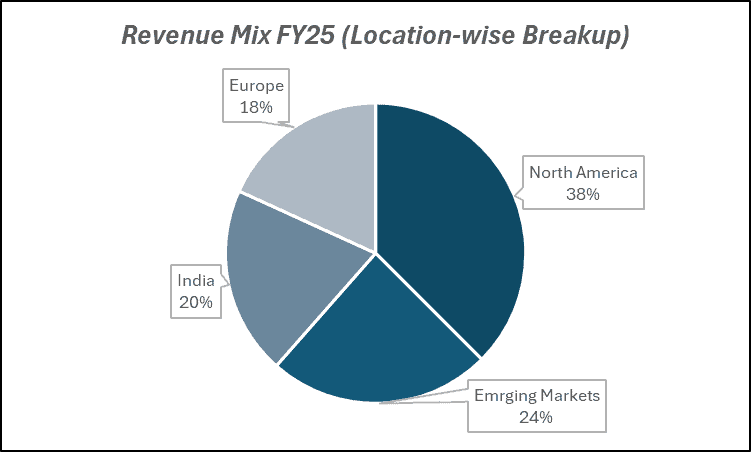
Founded in 1984 and headquartered in Hyderabad, Dr. Reddy’s is one of India’s leading multinational pharmaceutical companies. It operates across over 60 countries, with strong presence in the US, India, Russia, Europe, and emerging markets.
The company’s business spans generics, active pharmaceutical ingredients (APIs), biosimilars, and specialty formulations. Over the years, it has built a diversified portfolio that reduces dependence on any single geography or molecule.
Key business segments
Dr Reddy’s Laboratories Ltd. operates primarily in the following key business segments:
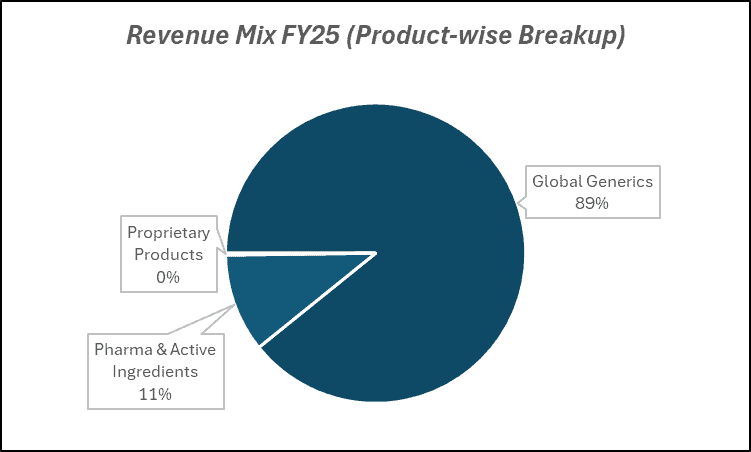
- Global Generics: Finished dosage formulations across US, Europe, India, and emerging markets.
- Pharmaceutical Services & APIs (PSAI): Active ingredients and custom manufacturing.
- Biosimilars: Oncology and immunology-focused biologics.
- Proprietary Products & Digital Health: Specialty and differentiated therapies.
Primary growth factors for Dr Reddy’s Laboratories Ltd.
Dr Reddy’s Laboratories Ltd. key growth drivers:
- Complex Generics Pipeline: Focus on injectables, dermatology, and niche molecules.
- Biosimilar Expansion: Growing presence in oncology and immunology portfolios.
- India Branded Formulations: Strong domestic market growth and chronic therapy leadership.
- Cost Optimization: Vertical integration and manufacturing efficiencies.
- New Product Launches: Regular ANDA approvals in regulated markets.
Detailed competition analysis for Dr Reddy’s Laboratories Ltd.
Key financial metrics – TTM;
| Company | Sales (₹ Cr.) | EBITDA (₹ Cr.) | EBITDA Margin (%) | PAT (₹ Cr.) | PAT Margin (%) | P/E |
| Dr Reddy’s Laboratories Ltd. | 34682.20 | 8068.90 | 23.27% | 5508.70 | 15.88% | 19.35 |
| Divi’s Laboratories Ltd. | 10314.00 | 3393.00 | 32.90% | 2479.00 | 24.04% | 67.38 |
| Torrent Pharma Ltd. | 12742.00 | 4167.00 | 32.70% | 2272.00 | 17.83% | 63.13 |
| Cipla Ltd. | 28351.08 | 6465.54 | 22.81% | 4544.70 | 16.03% | 23.90 |
| Lupin Ltd. | 26150.50 | 7651.59 | 29.26% | 4669.18 | 17.86% | 21.73 |
Key insights on Dr Reddy’s Laboratories Ltd.
- Diversified Geography: Reduced reliance on the US alone through India and EM growth.
- Strong Balance Sheet: Healthy cash position enabling R&D and acquisitions.
- API Integration: Backward integration supports margin stability.
- Specialty Transition: Gradual shift from commodity generics to differentiated products.
- Regulatory Track Record: Improved compliance culture across facilities.
Recent financial performance of Dr Reddy’s Laboratories Ltd. for Q3 FY26
| Metric | Q3 FY25 | Q2 FY26 | Q3 FY26 | QoQ Growth (%) | YoY Growth (%) |
| Sales (₹ Cr.) | 8381.20 | 8828.30 | 8753.40 | -0.85% | 4.44% |
| EBITDA (₹ Cr.) | 2273.00 | 2009.90 | 1887.50 | -6.09% | -16.96% |
| EBITDA Margin (%) | 27.12% | 22.77% | 21.56% | -121 bps | -556 bps |
| PAT (₹ Cr.) | 1400.00 | 1330.50 | 1187.30 | -10.76% | -15.19% |
| PAT Margin (%) | 16.70% | 15.07% | 13.56% | -151 bps | -314 bps |
| Adjusted EPS (₹) | 16.95 | 16.13 | 14.49 | -10.17% | -14.51% |
Dr Reddy’s Laboratories Ltd. financial update (Q3 FY26)
Financial performance
- Revenue grew 4.4% YoY to ₹8,753 Cr, driven by strong growth in India, Europe, Russia & CIS, and RoW, partly offset by US price erosion.
- EBITDA declined 17% YoY to ₹1,888 Cr, with margins contracting to 21.6% due to lower gross margins and weaker US contribution.
- PAT fell 15.2% YoY to ₹1,187 Cr amid margin compression.
- Gross margins stood at 64.6%, impacted by pricing pressure in select US generics.
- R&D spend remained steady at 7–8% of revenues, supporting future complex launches.
Business highlights
- US business was impacted by price erosion, though the base portfolio ex-Revlimid showed growth.
- India business grew 19% YoY, led by innovation portfolio and new product launches.
- Europe remained strong, supported by NRT portfolio growth and improving integration.
- Russia & CIS delivered robust double-digit growth with strong momentum.
- Biosimilars and GLP-1 pipeline (Semaglutide) remain key medium-term growth drivers.
Outlook
- Near-term performance may remain influenced by US pricing pressure.
- Growth to be driven by niche launches, biosimilars, and GLP-1 opportunities.
- Semaglutide launches across key markets expected to support branded portfolio expansion.
- Focus on complex generics and specialty products to improve margin profile.
- Disciplined capital allocation and steady R&D investments support long-term earnings visibility.
Recent Updates on Dr Reddy’s Laboratories Ltd.
- Strategic Acquisitions: Select bolt-on acquisitions to strengthen niche portfolios.
- Biosimilar Collaborations: Partnerships to expand global biologics footprint.
- Digital Health Initiatives: Expansion into digital therapeutics and patient engagement.
- Capacity Enhancements: Investments in injectables and biologics manufacturing.
- Portfolio Rationalization: Exit from low-margin segments to improve return ratios.
Company valuation insights – Dr Reddy’s Laboratories Ltd.
Dr. Reddy’s is currently trading at an EV/EBITDA multiple of 10x, with a 1-year return of 9.7%, modestly underperforming the NIFTY 50’s 13.4% gain. The muted stock performance reflects near-term pressure from US pricing erosion and tapering gRevlimid contribution. However, valuations remain reasonable relative to its long-term growth optionality, strong balance sheet, and improving product mix, offering scope for re-rating as complex launches scale up.
The investment case for Dr. Reddy’s is anchored in its expanding specialty and complex portfolio, strong India franchise, and upcoming biosimilar and GLP-1 opportunities. Despite US headwinds in Q3FY26, the base business ex-Revlimid remained resilient, while India grew 19% YoY driven by innovation and new launches. Europe and Russia & CIS delivered strong double-digit growth, supported by portfolio expansion and NRT integration. Looking ahead, Semaglutide launches across India, Canada, and Brazil, alongside biosimilars such as Abatacept, Rituximab, and Denosumab, are expected to drive the next earnings cycle. With R&D guided at 7–8% of revenues and increasing focus on complex generics, the company is structurally transitioning toward higher-value opportunities.
From a valuation standpoint, applying a 13x EV/EBITDA multiple to FY27E estimates, we arrive at a 12-month target price of ₹1,580, implying an upside potential of 24% from current levels. Over the near term, we assign a 3-month target price of ₹1,350, indicating a 6% upside, supported by stabilizing US base business, strong India momentum, and improving visibility from upcoming specialty launches.
Major risk factors affecting Dr Reddy’s Laboratories Ltd.
- US Pricing Pressure: Continued generic price erosion.
- Regulatory Risks: US FDA observations impacting facilities.
- Product Concentration: Dependency on select high-revenue molecules.
- Currency Volatility: Impact on export realizations.
- R&D Execution: Delays in complex launches or biosimilars.
Technical analysis of Dr Reddy’s Laboratories Ltd. share
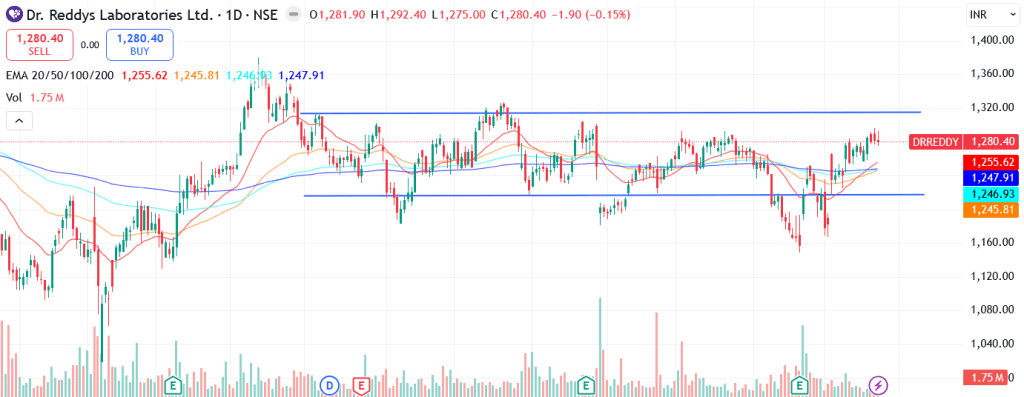
Dr. Reddy’s Laboratories is currently trading within a well-defined sideways channel, reflecting a phase of consolidation after its prior move. The stock has recently bounced back from the lower trendline of the channel and is now approaching the upper resistance band with improving momentum. A decisive breakout above this upper trendline could signal the beginning of a fresh upward leg, potentially leading to trend expansion beyond the current range.
Importantly, the price is trading above its 20-, 50-, 100-, and 200-day EMAs, indicating strong structural alignment across timeframes. This positioning reinforces the broader bullish bias, with moving averages likely to act as dynamic support zones during any short-term corrections.
Momentum indicators support the constructive setup. The MACD at 15.30 is in positive territory and trading above the signal line, indicating sustained bullish momentum. RSI at 60.10 reflects healthy buying interest without entering overbought territory, leaving room for further upside. Relative RSI over 21 and 55 days at 0.04 and 0.02 respectively signals short- and medium-term outperformance versus the broader market. ADX at 22.51 suggests the trend is gaining strength, supporting the probability of a breakout-led move.
A sustained move above ₹1,350 (channel resistance) could open the path toward ₹1,580, aligning with the 12-month fundamental target. On the downside, ₹1,210 remains a key support level; holding above this zone preserves the channel structure and limits near-term downside risk.
- RSI: 60.10 (Bullish; strong buying interest)
- ADX: 22.51 (Trend gaining strength)
- MACD: 15.30 (Positive; above signal line)
- Resistance: ₹1,350
- Support: ₹1,210
Dr Reddy’s Laboratories Ltd. stock recommendation
Current Stance: With a 3-month target of ₹1,350 (6% upside) and a 12-month target of ₹1,580 (24% upside), based on 13x FY27E EV/EBITDA.

Why buy now?

Stabilizing US base business (ex-gRevlimid) with improving visibility as price erosion moderates and new launches gain traction.

Strong India momentum, delivering high-teen growth led by innovation portfolio and continued market share gains in chronic therapies.

Upcoming GLP-1 (Semaglutide) launches across India, Canada, and Brazil providing meaningful medium-term revenue optionality.

Robust biosimilar pipeline (Abatacept, Rituximab, Denosumab) expected to drive the next earnings cycle from FY27 onwards.

Disciplined R&D spend (7–8% of sales), strong balance sheet, and focus on complex generics supporting sustainable margin recovery and return ratios.

Portfolio fit

Dr. Reddy’s offers exposure to a diversified global pharma platform with a balanced mix of US generics, branded India business, emerging markets, and specialty opportunities. The company is transitioning from dependence on limited windfall products toward a structurally stronger complex and biosimilar-led portfolio. With improving earnings visibility, prudent capital allocation, and reasonable valuations relative to long-term growth potential, the stock fits well in portfolios seeking defensive growth, global diversification, and steady cash flow generation beyond purely domestic cyclical themes.
If you found this helpful and want regular stock trade calls, check out my community on StockGro here: https://app.stockgro.club/ui/social/tradeViews/groupFeed/07a7b961-b8ca-42ce-baf3-a9eec781b6ebDr Reddy’s Laboratories Ltd.: Budget 2026-27 opportunities
- Healthcare PLI Expansion: Incentives for APIs and domestic manufacturing.
- R&D Support: Increased funding for biologics and specialty drug development.
- Export Incentives: Trade facilitation for pharma exports.
- Healthcare Infrastructure: Rising domestic demand via insurance penetration.
- Digital Health Push: Policy support for telemedicine and digital therapeutics.
Final thoughts
Dr. Reddy’s represents a balanced pharmaceutical story, combining the cash stability of generics with the growth optionality of biosimilars and specialty therapies. Its strategic pivot toward complex molecules and biologics, backed by a strong balance sheet and diversified geography, positions it for steady compounding.
For investors seeking exposure to global pharmaceuticals with improving quality of earnings and innovation-led upside, Dr. Reddy’s offers a blend of resilience and strategic transformation.