- Summary
- WeWork India Q2 FY27 results highlighted a 67.4% year-on-year (YoY) increase in its consolidated net profit to ₹65.8 crore in Q2 FY27, compared with ₹39.3 crore in Q2 FY26.
- The total revenue rose 31.6% to ₹768.7 crore.
- Enterprise members total contributed 77.3% of the core revenue and non-enterprise members contributed 22.7%.
- Its operating free cash flow increased 149.2% YoY to ₹237.70 crore, representing 1.6 times EBITDA conversion.
- The WeWork India H1 FY27 results showed a 30.1% rise in total income to ₹1,466.7 crore.
- H1 FY27 PAT rose 149.5% YoY to ₹119 crore.
WeWork India Q2 FY27 results reflect rising revenue of over 31.6% YoY and net profit reaching ₹65.8 crore, up by over 67.4% YoY. The company’s performance highlights its growth in the office space business as more companies use flexible workspaces.
The Q2 FY27 results offer an update on the company’s financial performance and its progress in India’s growing flexible office space market. Read ahead to know more!
Key Numbers at a Glance
The WeWork India Q2 FY27 results highlight key financial figures and year-on-year and quarter-on-quarter changes:
| Metric | Q2 FY27(in ₹ crore) | Q2 FY26(in ₹ crore) | YoY % Change | QoQ % Change |
| Total Revenue | 768.7 | 584.0 | +31.6% | +10.1% |
| Revenue from Operations | 766.5 | 578.4 | +32.5% | +11.5% |
| EBITDA | 162.9 | 118.4 | +37.6% | +17.8% |
| Net Profit (PAT) | 65.8 | 39.4 | +67.4% | +23.7% |
| ROCE | 34.5% | 22.2% | – | – |
| Core Operations Revenue | 657.7 | 499.5 | +31.7% | +9.0% |
| Value-Added Services Revenue | 79.6 | 58.9 | +35.2% | +38.4% |
| Digital Products Revenue | 29.2 | 20.0 | +45.6% | +11.3% |
| Centre-Level EBITDA | 214.0 | 154.6 | +38.4% | +15.1% |
| Operating Free Cash Flow (FCFO) | 237.7 | 95.4 | +149.2% | +67.5% |
How Much Revenue Did WeWork India Make in Q2 FY27?
WeWork India revenue from operations that covers its main workspace business and related services stood at ₹766.5 crore, growing 32.5% year-on-year. The company also recorded a 10.1% increase in total revenue compared with Q1 FY27.
Revenue by Business Segment
| Business Segment | Q2 FY27(in ₹ crore) | Q2 FY26(in ₹ crore) | YoY % Change | QoQ % Change |
| Core Operations:Private Offices & Managed Office | 657.7 | 499.5 | +31.7% | +9.0% |
| Value Added Services:Events, F&B, Customisation, Tech | 79.6 | 58.9 | +35.2% | +38.4% |
| Digital Products:Workplace, All Access, Virtual | 29.2 | 20.0 | +45.6% | +11.3% |
| Total | 766.5 | 578.4 | +32.5% | +11.5% |
Who Are WeWork India’s Biggest Customers?
WeWork India results provide a breakdown of its revenue by member type, sector and geography for Q2 FY27.
- By member type: Fortune 500 companies contributed 28.5% of core revenue, large enterprises 34.4%, other enterprises 14.4% and non-enterprise members 22.7%. Enterprise members together accounted for 77.3% of core revenue.
- By sector: Technology contributed 26.9% of core revenue, followed by BFSI at 15.8%, professional services at 11.9%, media at 7.5%, IT services and consulting at 6.1%, manufacturing at 4.9% and pharmaceuticals and healthcare at 4.5%.
- By geography: Indian companies accounted for 33.7% of core revenue, while international members contributed the remaining 66.3%.
- Top 10 members: The company’s top 10 members together contributed 23.2% of core revenue.
Did WeWork India’s Profit Grow?
Yes. WeWork India profit growth was stronger in Q2 FY27. Here are the key insights:
EBITDA and EBITDA Margin
| Metric | Q2 FY27 | Q2 FY26 | YoY % Change | QoQ % Change |
| EBITDA (in ₹ crore) | 162.9 | 118.4 | +37.6% | +17.8% |
| EBITDA Margin | 21.2% | 20.28% | +92 bps | +138 bps |
Net Profit Rises 67.4% to ₹65.8 Crore
| Metric | Q2 FY27 | Q2 FY26 | YoY % Change | QoQ % Change |
| PAT (in ₹ crore) | 65.8 | 39.3 | +67.4% | +23.7% |
| PAT Margin | 8.6% | 6.7% | +183 bps | +94 bps |
Why Profit Grew Faster Than Revenue
- Faster service growth: The revenue from digital products grew 45.6% YoY, while value-added service revenue increased 35.2% YoY, outpacing growth in core operations.
- Higher occupancy: The mature centres with an occupancy of 87.7% helped the existing locations to earn more from their available desks.
- More business customers: Enterprise clients contributed 77.3% of core revenue, supporting demand for office spaces.
- Better operating performance: EBITDA grew 37.6%, faster than revenue growth of 31.6%, while EBITDA margin rose to 21.2%.
WeWork India’s Occupancy, Desks and Centres
WeWork India’s occupancy, desk capacity and centre network offer insight into the growth of the flexible workspace market.
Occupancy at Mature vs New Centres
| Metric | Q2 FY27 | Q2 FY26 |
| Mature Centres (>12 months) | ||
| Occupancy | 87.7% | 84.2% |
| Occupied Members (in thousands) | 105.5 | 84.5 |
| Operational Capacity (in thousands of desks) | 145.3 | 106.3 |
| New/Growth Centres (≤12 months) | ||
| Occupancy | 64.8% | 51.4% |
| Occupied Members (in thousands) | 16.2 | 7.3 |
| Operational Capacity (in thousands of desks) | 25.0 | 14.2 |
City-wise Centres and Desks
| City | Operational Centres | Operational Area (million sq. ft.) | Desk Capacity |
| Delhi | 2 | 0.2 | 2,500 |
| Noida | 3 | 0.3 | 4,100 |
| Gurugram | 12 | 1.2 | 15,300 |
| Mumbai | 14 | 1.5 | 19,800 |
| Pune | 10 | 1.0 | 16,900 |
| Bengaluru | 32 | 3.5 | 54,200 |
| Chennai | 4 | 0.8 | 12,500 |
| Hyderabad | 8 | 1.3 | 20,000 |
| Total | 85 | 9.8 | 145,300 |
WeWork India Cash Flow and Debt
Here is an insight into WeWork India’s cash flow, debt levels and return on capital:
Cash From Operations vs Capex
| Particulars | Q2 FY26(in ₹ crore) | Q2 FY27(in ₹ crore) |
| Cash Flow from Operations | 375.2 | 590.4 |
| Less: Lease Liability Outflow | (245.6) | (298.2) |
| Less: Brokerage Outflow | (34.2) | (54.5) |
| Free Cash Flow from Operations (FCFO) | 95.4 | 237.7 |
| Less: Capital Expenditure (Capex) | (109.5) | (175.8) |
| Free Cash Flow to the Firm (FCFF) | -14.1 | 61.9 |
Net Debt and Return on Capital
| Particulars | Q2 FY26(in ₹ crore) | Q2 FY27(in ₹ crore) |
| Gross Debt (in ₹ crore) | 409.6 | 390.2 |
| Cash and Cash Equivalents (in ₹ crore) | 99.1 | 413.3 |
| Net Debt / (Net Cash) (in ₹ crore) | 310.5 | (23.1) |
| Net Debt / EBITDA (in times) | 0.76 | (0.04) |
| Average Cost of Borrowing | 10.4% | 8.5% |
| Credit Rating | A− | A+ |
| Return on Capital Employed (ROCE) | 22.2% | 34.5% |
What Did WeWork India’s Management Say About Q2 FY27?
Management said the WeWork India Q2 FY27 results reflected demand keeping pace with the company’s recent expansion. It also pointed to improving customer retention, GCC demand and better returns from newer centres as key trends for the business.
Karan Virwani, Managing Director and CEO, said flexible workspaces are becoming a larger part of India’s office market. In calendar Q3 2026, flex accounted for 24% of office leasing in India, while GCCs contributed about 41%. Management sees both trends supporting the flexible workspace market over the longer term.
Main points from the management commentary include:
- Demand kept pace with expansion: WeWork India added 30,800 desks YoY and nearly 30,000 members over the same period. Management also said churn remained lower than expected, helping occupancy improve across mature and newer centres.
- Customer retention remained high: Renewal rates were around 80-85% in H1 FY27. Larger clients were also staying longer, with commitments averaging about 32 months. Across customers, the average was 28 months, while contracts typically include a 6-7% annual price increase.
- GCC demand continues as a key driver: GCC customers contribute ~40% of WeWork India’s core revenue. Management said global businesses continue to move functions to India and bring some work in-house, supporting GCC growth India and demand for flexible offices.
- Returns are improving as centres mature: Management said pricing has remained steady, while better space design & capex control are improving payback periods. Occupancy ramp-up timelines have also shortened, supporting WeWork India profit growth as recently opened centres mature.
Cost pressures remain a factor. Management pointed out higher minimum wages, including an increase of nearly 60% in Karnataka, plus higher energy tariffs. It said the Q2 EBITDA margin could have been closer to 22-23% without these additional costs, compared with the reported 21.2%.
Management also sees opportunities beyond desk rentals. It spotlighted value-added services and digital products as higher-margin businesses, while growing digital usage is being viewed as a sign that customers increasingly want flexible and on-demand ways to use office space.
WeWork India FY27 Guidance and Expansion Plans
WeWork India is aiming for 150,000 to 155,000 operational desks by March 2027, along with 10 to 10.3 million sq ft of operational space. Capacity was already close to the lower end of that range in early October, after another 4,500 desks came online.
The expansion pipeline is also fairly large:
- More than 47K desks are already in the pipeline: Over 9000 desks are under signed leases and fit-out. Another 38,000+ desks are covered by signed letters of intent.
- Capacity plans go beyond FY27: WeWork India has visibility on around 190,000 to 200,000 desks across 13.0 million sq ft. Supply for FY28 and FY29 is already being worked on, which keeps the company active in India’s flexible workspace market.
- FY27 capex is expected at around ₹500 crore: Spending in H2 should be lower than in H1. For FY28, capex may rise closer to ₹600 crore or slightly above as more centres are added.
Management also said the 150,000 to 155,000 desk range gives some room for timing changes. A few centre openings could slip into early April because of landlord handovers or customer requirements.
Even with the larger pipeline, the company expects future expansion spending to stay below the cash generated by the business.
How Did WeWork India’s Share Price Move After Q2 FY27 Results?
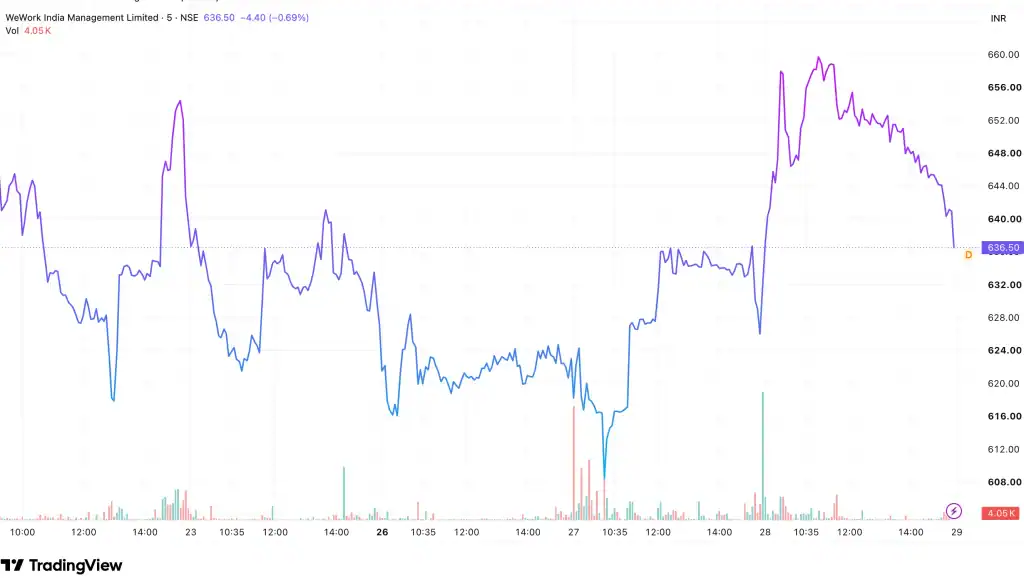
The WeWork India share price closed at ₹626.10 on the NSE on 27 October 2026, up 0.43% from the previous close of ₹623.40. The WeWork India Q2 FY27 results were released after market hours on 26 October.
On 27 October:
- The stock opened at ₹624.00.
- It touched a high of ₹648.00 and a low of ₹607.15.
- The intraday range was about 6.6% of the previous close.
- Around 5.5 lakh shares were traded, nearly five times the 20-session average.
The stock ended the session only ₹2.70 above its previous close, despite the wider intraday movement. At the close, the shares were about 21.2% below their 52-week high and 49.1% above the 52-week low.
What to Watch next in WeWork India’s Results
WeWork India has added capacity fast. The next test is how quickly those desks fill up and start supporting revenue, margins and cash flow.
Key areas to track in the next WeWork India results are:
- Occupancy at newer centres: Growth centres were at 64.8% occupancy in Q2 FY27, against 87.7% for mature centres. A narrower gap would show that recently opened locations are filling up as planned.
- Desk additions versus member growth: Operational desk capacity grew 26.9% YoY, while members increased 32.5%. Keeping member growth close to, or ahead of, new capacity will matter as the expansion continues.
- Margin movement: EBITDA margin stood at 21.2% in Q2. Management expects further improvement as newer centres mature, so H2 margins will be important for WeWork India profit growth.
- Cash generation during expansion: The company is still spending on new centres. The key number to watch is whether operating cash generation continues to cover the investment needed for this growth.
- Revenue mix: Value-added services and digital products are growing faster than the core workspace business and carry higher margins. Their contribution will matter as the business gets larger.
- Enterprise and GCC mix: Enterprise customers contributed 77.3% of core revenue, while GCCs accounted for 40.8%in Q2 FY27. In the next WeWork India results, watch whether these shares hold as new centres fill up, along with renewal rates and contract duration for larger accounts.
FAQs on WeWork India Q2 FY27 Results
WeWork India reported revenue of ₹768.7 crore, EBITDA of ₹162.9 crore and PAT of ₹65.8 crore in Q2 FY27. Overall occupancy stood at 83.7%.
Yes. WeWork India reported PAT of ₹65.8 crore in Q2 FY27, up 67.4% YoY. EBITDA also rose to ₹162.9 crore during the quarter.
Embassy Buildcon LLP is WeWork India’s largest shareholder, holding 48.06% as of 30 September 2026.
WeWork India’s overall occupancy stood at 83.7% in Q2 FY27. Mature centres were at 87.7%, while newer growth centres were at 64.8%.