
- Summary
- WeWork India reported revenue from operations of ₹766.5 crore, increasing 32.5% YoY, while Smartworks recorded revenue of ₹591.4 crore, up 39% YoY.
- WeWork India’s EBITDA reached ₹162.9 crore, up 37.6% YoY; Smartworks’ normalised EBITDA was ₹116.9 crore, up 68% YoY.
- The IGAAP-equivalent PAT of WeWork India increased 67.4% YoY to ₹65.8 crore, while Smartworks’ normalised PAT rose 136% YoY to ₹43.4 crore.
- The operational area of WeWork India grew 27.1% YoY to 9.8 MSF, whereas Smartworks’ operational area increased to 10.9 MSF from 9.1 MSF.
- WeWork India’s overall occupancy improved 357 basis points YoY to 83.7%, whereas Smartworks maintained occupancy at 81%.
WeWork India vs Smartworks Q2 FY27 Results at a Glance
The table below presents the key numbers of the WeWork India vs Smartworks Q2 FY27 results:
| Particulars | WeWork India | Smartworks |
| Revenue from Operations (₹ crore) | 766.5 | 591.4 |
| Revenue Growth (YoY) | 32.5 | 39 |
| EBITDA (₹ crore) | 162.9 | 116.9 |
| EBITDA Margin (%) | 21.2 | 19.8 |
| EBITDA Growth (YoY %) | 37.6 | 68 |
| Profit After Tax (PAT) (₹ crore) | 65.8 | 43.4 |
| PAT Growth (YoY %) | 67.4 | 136 |
| PAT Margin (%) | 8.6 | 7.3 |
| Portfolio Occupancy (%) | 83.7 | 81 |
| Mature Centre Occupancy (%) | 87.7 | 88 |
| Operational Area (in million sq. ft.) | 9.8 | 10.9 |
| Number of Centres | 85 | 71 |
| Cities of Operation | 8 | 15 |
How WeWork India and Smartworks Make Money
WeWork India and Smartworks both operate under a Workspace-as-a-Service (WaaS) and managed office model that shifts away from the traditional high-risk coworking model to focus heavily on large enterprises, Global Capability Centres (GCCs) and Fortune 500 companies.
However, their offerings differ in terms of workspace formats, infrastructure and service delivery.
How WeWork India Makes Money
- Membership and Desk Fees: It leases premium commercial properties in prime business districts, aligns them with office infrastructure and re-rents individual desks, private offices and managed workspaces to businesses.
- Enterprise Focus: Approximately 75% of WeWork India’s revenue comes from large enterprises, with corporate clients and GCCs forming a significant share of its demand for dedicated office spaces.
- Value-Added Services: Beyond workspace rentals, the company charges for office customisation, food and beverages, events and other workplace services that form part of its Workspace-as-a-Service offering.
- Flexible Workspace Products: All Access memberships, day passes and virtual offices allow professionals and businesses to use WeWork’s facilities without committing to conventional long-term office leases.
How Smartworks Makes Money
- Large-Format Leasing: It leases entire commercial buildings from institutional developers and landlords, then converts these properties into large managed office campuses for corporate tenants.
- Enterprise-Led Revenue: The company’s enterprise clients contribute approximately 91% of the rental revenue, reflecting its focus on large companies.
- Customised Office Development: Through its WorkSpace-as-a-Service model, Smartworks designs, builds and furnishes offices around client requirements, allowing businesses to occupy operational workspaces without managing the entire setup themselves.
- Integrated Campus Services: Its campuses combine office space with cafés, gyms, crèches, medical rooms, transport facilities and IT support, creating additional service opportunities beyond conventional office rentals.
Q2 FY27 Revenue and Growth: WeWork India vs Smartworks
WeWork India’s Q2 FY27 results showed a higher revenue figure. However, Smartworks reported a stronger YoY revenue increase of 39%. The table below provides a breakdown:
| Revenue Metric | WeWork India | Smartworks |
| Revenue from operations (in ₹ crore) | 766.5 | 591.4 |
| YoY Growth (%) | 32.5 | 39 |
| QoQ Growth (%) | 11.5 | 8 |
Operating Metrics: Seats, Centres, Occupancy and Pipeline
Here is how WeWork India and Smartworks differ in terms of operating metrics:
| Operating Metric | WeWork India | Smartworks | ||
| Q2 FY27 | Q2 FY26 | Q2 FY27 | Q2 FY26 | |
| Operational Area (million sq. ft.) | 9.8 | 7.7 | 10.9 | 9.1 |
| Total Area (million sq. ft.) | 13.0 | 10.0 | 17.5 | 12.7 |
| Operational Desk/Seat Capacity | 145.3k | 114.5k | 249k | 207k |
| Occupied Members/Seats | 121.7k | 91.8k | 201k | 168k |
| Number of Centres | 85 | 70 | 71 | 59 |
| Cities of Operation | 8 | 8 | 15 | 14 |
| Overall Occupancy | 83.7% | 80.2% | 81% | 81% |
| Mature Centre Occupancy | 87.7% | 84.5% | 88% | 88% |
| Committed Mature Occupancy | – | – | 91% | 93% |
| Future Capacity Pipeline | 47k incremental desks committed | – | 17.5 million sq. ft. total SBA, including LOIs and term sheets | – |
WeWork India and Smartworks Profitability: Reported vs Real
The reported EBITDA margins of WeWork India and Smartworks appear high because Ind AS 116 changes how lease expenses are presented in the financial statements. Here is an overview:
| Profitability | WeWork India | Smartworks | ||
| Reported(IndAS) | Adjusted (IGAAP Equivalent) | Reported | Adjusted(Normalised) | |
| EBITDA (₹ crore) | 508.7 | 162.9 | 377.6 | 116.9 |
| EBITDA Margin (%) | 64.7 | 21.2 | 63.8 | 19.8 |
| PAT (₹ crore) | 20.5 | 65.8 | 25.6 | 43.4 |
| PAT margin (%) | 2.6 | 8.6 | – | 7.3 |
Balance Sheet and Cash Flow: WeWork India vs Smartworks
The table below provides insights into key balance sheet and cash flow figures:
| Metric | WeWork India | Smartworks |
| Net debt (₹ crore) | (23.1) | 82.7 |
| Gross debt (₹ crore) | 390.2 | 233.7 |
| Return on capital employed (RoCE) | 34.5% | 21.6% |
| Total assets (₹ crore) | 7,369.82 | – |
| Cash and cash equivalents | 413.3 | – |
| Cash flow from operations (₹ crore) | 590.4 | 367.8 |
| Operating cash flow / FCFO (₹ crore) | 237.7 | 107.1 |
| Capital expenditure (₹ crore) | 175.8 | 155.6 |
| Free cash flow (₹ crore) | 61.9 (FCFF) | (48.5) |
| Lease liabilities (₹ crore) | 4,520.37 (non-current); 712.75 (current) | – |
| Normalised OCF / EBITDA | – | 0.9× |
| Annualised cash RoCE | – | 38.9% |
Return Ratios: ROE and ROCE Compared
The ROE and ROCE of WeWork India and Smartworks for Q2 FY27 are given below:
| WeWork India | Smartworks | |
| ROE | Not Disclosed | Not disclosed |
| ROCE (annualised %) | 34.5 | 21.6 |
| ROCE YOY improvement | 1,235 bps | 800 bps |
WeWork India vs Smartworks Valuation: P/E, EV/EBITDA and Market Cap
The following table compares WeWork India and Smartworks using the latest available market valuation data as of 2nd November 2026:
| WeWork India | Smartworks | |
| P/E (in times) | 87.41 | 96.75 |
| EV/EBITDA | _ | _ |
| Market Capitalisation (in cr) | 9,089.75 | 5,544.05 |
On 2 November 2026, WeWork India had a higher market cap of ₹9,089.75 crore compared to Smartworks’ ₹5,544.05 crore. This shows that the market values WeWork India at a higher overall amount.
Shareholding and Promoter Risk
The September 2026 shareholding disclosures show differences in promoter ownership and pledged shares between WeWork India and Smartworks.
- WeWork India: Promoters held 48.20% of the company’s shares as of 30 September 2026. Around 34.97% of their holdings were pledged. This equals approximately 16.86% of the company’s total share capital.
- Smartworks: Promoters held 58.26% of the company’s shares. The company reported no pledged promoter shares during the same period.
This makes promoter pledging an important risk to watch in WeWork India. Although both companies have significant promoter ownership, WeWork India’s pledged shares create an additional concern that is not present in Smartworks’ reported shareholding. Investors should track any changes in promoter ownership and pledged shares in future quarterly disclosures.
What Management Said on the Q2 Earnings Calls
Both companies discussed their expansion plans, enterprise demand and profit growth. However, their focus areas were slightly different.
WeWork India
During its Q2 FY27 earnings discussion, WeWork India’s management highlighted these points:
- Expansion plans: The company aims to increase its capacity to 1.5–1.55 lakh desks by March 2027.
- Enterprise demand: The enterprise clients contributed 77% of core revenue, while Fortune 500 companies contributed around 30%.
- Profit margins: Management expects EBITDA margins to reach 22–23% in FY28.
- Value-added services: Digital and other additional services are growing faster than core workspace revenue.
- Cash generation: The company reported ₹237.7 crore in free cash flow from operations during Q2 FY27.
Smartworks
In their Q2 FY27 shareholders’ letter, management highlighted the following points:
- Revenue growth: Smartworks increased its FY27 revenue growth guidance from 28–30% to 33–35%.
- Expansion plans: The company plans to add 2.5–3 million sq. ft. of operational space during FY27.
- Enterprise demand: It signed contracts worth approximately ₹540 crore in rental revenue during Q2 FY27.
- Profit margins: Management expects normalised EBITDA margins to remain between 19% and 20%.
- Cash flow: Cash flow may remain low in the coming quarters because of investments in new centres and security deposits.
Market Reaction: Share Price, Broker Targets and Technicals
The market reaction to Q2 FY27 results can help investors understand how the two stocks are performing after their latest earnings announcements. Three factors are important: share price movement, broker views and technical indicators.
1. Share price movement
| Particulars | WeWork India | Smartworks |
| Share price before result | ₹623.40 (26 Oct 2026) | ₹480.50 (30 Oct 2026) |
| Closing price after result | ₹626.10 (27 Oct 2026) | ₹479.20 (2 Nov 2026) |
| Change | 0.43% | -0.27% |
WeWork India’s share price increased by around 0.43% in the first trading session after its Q2 presentation. Smartworks’ share price declined by around 0.27% in the first trading session after its Q2 results. This shows a slightly more positive immediate market reaction to WeWork India’s results. However, one trading session is not enough to judge the long-term performance of either stock.
2. Broker Targets
Neither WeWork India’s nor Smartworks’ Q2 FY27 investor presentation provides an official broker price target.
- WeWork India: Its management has discussed expansion, revenue growth and margin improvement, but these are business expectations, not share-price targets.
- Smartworks: The company’s management has raised its FY27 revenue growth guidance to around 33–35% and expects normalised EBITDA margins to 19–20%.
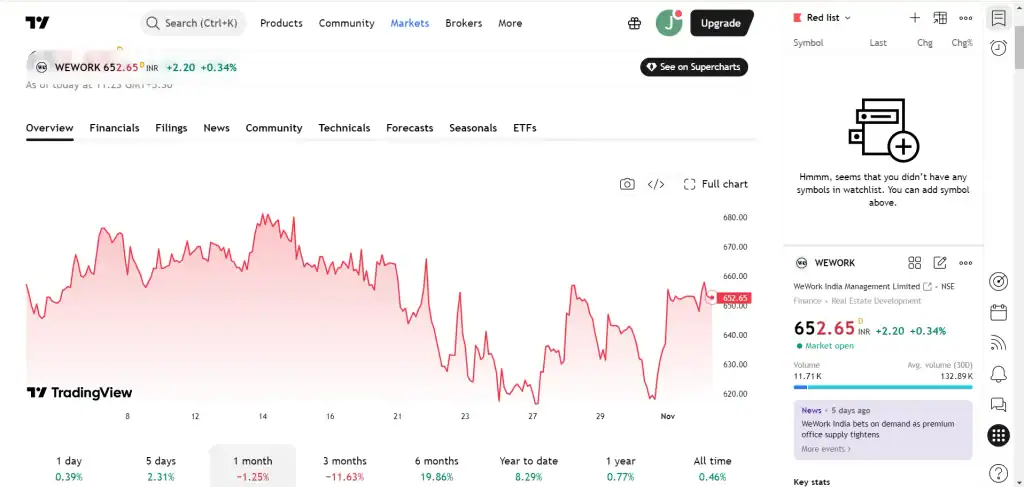
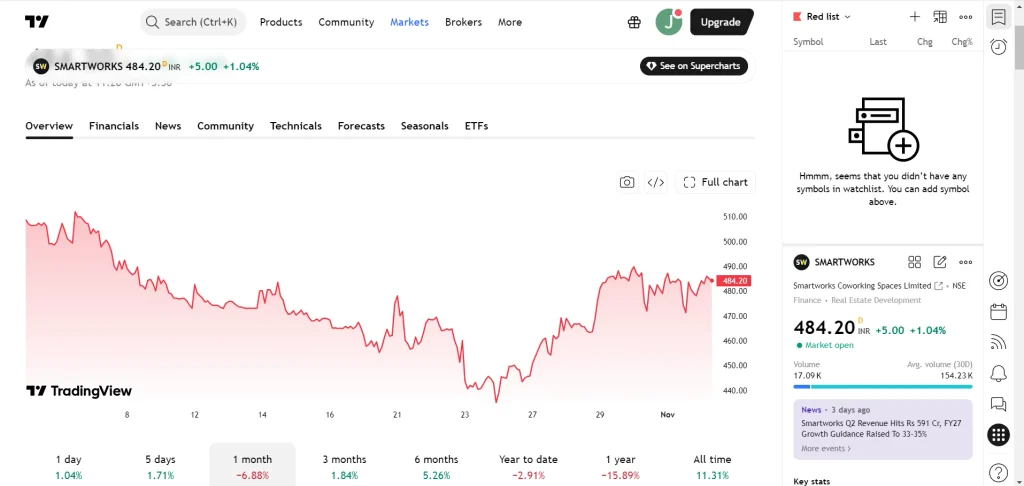
3. Technicals
Key Risks of Investing in WeWork India vs Smartworks Stock
Both companies face risks because they lease office spaces, spend money on setting up new centres and depend on businesses to rent their offices. The following table compares the main risks investors should watch.
| Risk Basis | WeWork India | Smartworks |
| Lease Commitment | Must pay rent for leased offices even if some desks remain vacant | Has similar rent obligations across its office portfolio |
| Expansion Risk | Its total area was 13 million sq. ft., of which 9.8 million sq. ft. was operational in Q2 FY27. New centres need time to attract clients | Its total footprint was 17.5 million sq. ft., with 10.9 million sq. ft. operational. New centres may take time to reach healthy occupancy |
| Cash Flow Risk | Needs to maintain cash generation to fund new centres and expansion | Reported negative free cash flow of around ₹104 crore in H1 FY27, mainly due to expansion spending and security deposits |
| Client dependence | Enterprise clients contributed 77% of core revenue. A fall in corporate demand could affect occupancy and revenue | Enterprise clients contributed 91% of rental revenue, making the company dependent on corporate demand |
| Promoter pledge | Around 34.97% of promoter holdings were pledged as of September 2026 | Reported no pledged promoter shares as of September 2026 |
Which Investor Profile Suits WeWork India vs Smartworks
WeWork India and Smartworks may be suitable for investors who have different expectations. WeWork India has reported stronger EBITDA margins and positive operating cash flow, while Smartworks has delivered faster revenue growth and increased its FY27 growth guidance.
| Particulars | WeWork India | Smartworks |
| Investors looking for higher profitability | May suit investors who prefer stronger EBITDA margins. Its Q2 FY27 EBITDA margin was 21.2% | May suit investors comfortable with a lower margin of 19.8% while the business grows |
| Investors looking for faster growth | Revenue grew 31.6% year-on-year in Q2 FY27 | Revenue grew 39% year-on-year, and FY27 growth guidance was raised to 33–35% |
| Investors who track cash flow | Reported ₹237.7 crore in free cash flow from operations during Q2 FY27 | Cash flow needs close attention because of spending on new centres and security deposits |
| Investors comfortable with expansion risk | May appeal to investors who prefer a company with an established network of 85 centres across 8 cities | May appeal to investors comfortable with expansion into new locations and a larger office footprint |
| Investors concerned about promoter pledging | Need to monitor pledged promoter shares, which stood at 34.97% of promoter holdings in September 2026 | Had no pledged promoter shares in its September 2026 disclosure |
WeWork India may appeal to investors who prefer higher profit margins, positive cash flow and an established business network. Smartworks may suit those looking for faster revenue growth and business expansion. Before choosing either stock, investors should compare their valuations, debt, cash flow, expansion costs and promoter share pledging.
FAQs
WeWork India reported revenue of ₹768.7 crore in Q2 FY27, up 31.6% from the same quarter last year. Its EBITDA rose 37.6% to ₹162.9 crore, with an EBITDA margin of 21.2%. Profit after tax (PAT) increased 67.4% to ₹65.8 crore. During the quarter, the company operated 85 centres across 8 cities, with an overall occupancy rate of 83.7%.
Smartworks reported revenue of ₹591.4 crore in Q2 FY27, a 39% year-on-year increase. Its normalised EBITDA grew 68% to ₹116.9 crore, while normalised PAT rose 136% to around ₹43.4 crore. The company had 71 centres across 15 cities, with an operational area of 10.9 million sq. ft.
Some of the leading coworking and managed office companies in India are Table Space, Smartworks, WeWork India, Awfis Space Solutions, and IndiQube Spaces.