We have all been there where you look at a stock chart and wonder when the prices might reverse. Candlestick patterns provide traders globally with hints about the sentiments of the market. Hammer Doji is one such signal. It is actually a useful pattern that could be used to clue in bullish reversals.
This blog will take you through an understanding of what the Hammer Doji is, how to identify it, and how it can be used to make better trading decisions.
What is a Hammer Doji Pattern?
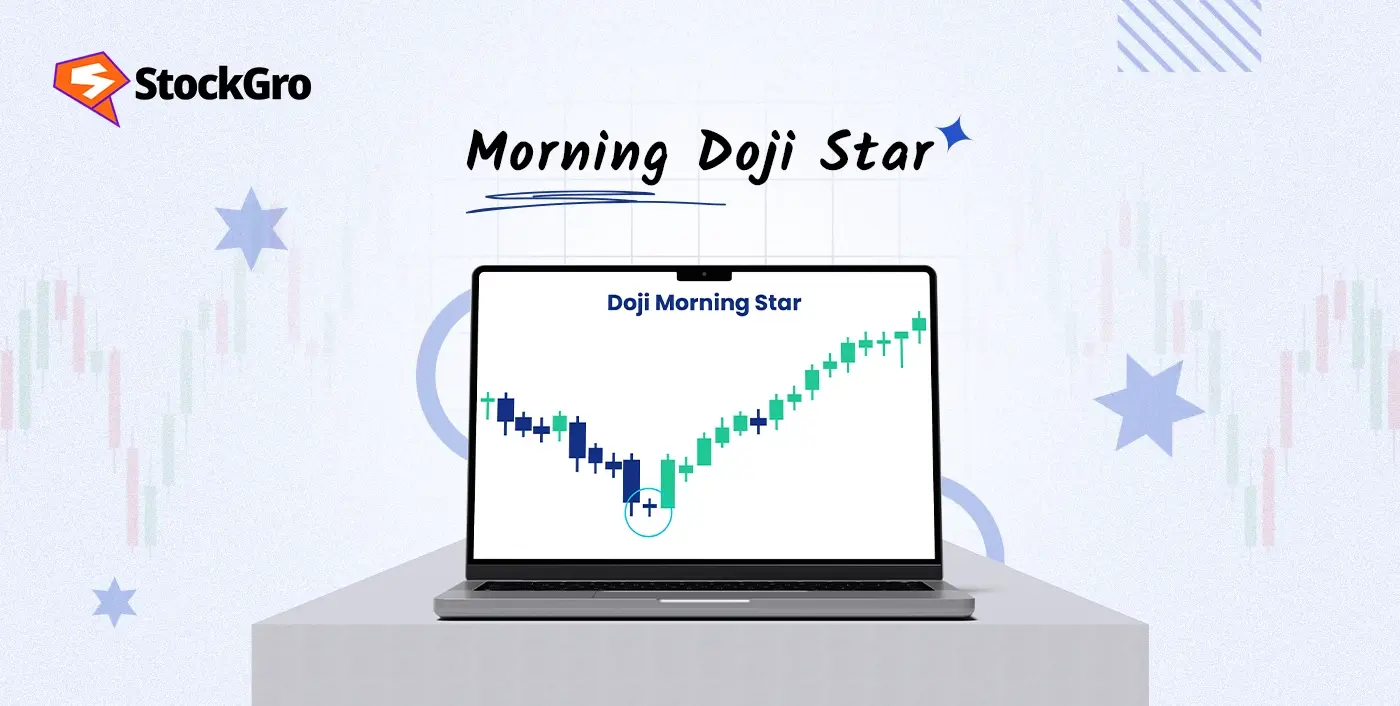
A candlestick pattern that is present at the end of a falling candlestick formation is referred to as a Hammer Doji. It typically indicates the potential bullish reversal. It has a long bottom shadow and a little top body like a hammer.
The open and close prices are close to each other and the same is depicted through the small body. On the other hand, the long lower tail portrays that the prices were aimed to go down however the buyers came to the rescue. This pattern can be an excellent technical analysis tool for a trader.
How is the Hammer Doji Formed?
The doji is most likely formed when:
- The start and end prices are almost the same.
- The lower shadow is very long.
- There’s little to no upper wick.
- It occurs after a noticeable downtrend.
This trend indicates that the sellers dominated the session, but buyers intervened and succeeded to take the price higher to almost its original position.
Characteristics of a Hammer Doji
Here are some of the characteristics of Hammer Doji that you can consider for intraday trading.
- Small Real Body
The small actual body of the Hammer Doji is a sign of indecisiveness, although it tends to be a bullish reversal when used following a down trend.
- Long Lower Shadow
This is a very important part of the pattern. This means that it represents a selling pressure that was absorbed by buyers, and it is a sign of strength.
- Appears After a Downtrend
The Hammer Doji only holds significance when it appears after a prolonged downtrend. It is an indication that the market pressure towards a bear trend could be ending.
What Does the Hammer Doji Indicate?
When you see a Hammer Doji declining, this can be your cue that the market is about to see a change. Despite downward pressure from sellers, prices ended the session close to where they began, indicating a successful buying session. That’s a strong sign of changing sentiment.
However, this doesn’t mean you should jump into a trade immediately. A Hammer Doji is not a signal of approval when displayed alone; rather, it represents a warning. You need confirmation.
How to Trade Using the Hammer Doji Pattern
The Hammer Doji can be a helpful signal in spotting potential reversals, especially in downtrending markets. But timing and context are everything. Follow these steps to trade this pattern better:
- Wait for a Strong Confirmation Candle
Do not act immediately after seeing a Hammer Doji. The trend itself merely indicates the possibility of creating an impulse in a different direction and not a certain reversal. Such a follow-through action is reassurance that buyers are indeed taking control and pushing up the price.
- Look for Key Support Levels Nearby
If the Hammer Doji appears near a well-tested support zone, like a previous swing low or a demand area, it adds more credibility to the pattern. Support levels act like psychological floors, and when a reversal signal like the Hammer Doji forms here, it carries more weight.
- Place Your Stop Loss Wisely
The process of risk analysis is as significant as that of pattern detection. The best location to place your stop loss is slightly beneath the lower wick (or shadow) of the Hammer Doji. When the price moves below this level, it normally implies that the pattern has been defeated, and it would be advisable to close the trade.
- Set a Realistic Profit Target
Do not set out to achieve unclear or excessively ambitious profits. Rather, find the closest logical place of logical resistance, or use an obvious risk-to-reward ratio, such as 1:2 or 1:3, to plot your exit. This would keep you in order and trade with discipline, particularly during volatile moves.
Best Confirmation Indicators for Hammer Doji
To improve your success rate, combine the Hammer Doji with technical indicators.
- Volume
When the Hammer Doji is forming, more volume makes the reversal signal stronger. A surge in volume indicates buyer interest.
- Relative Strength Index (RSI)
As the Hammer Doji appears and the RSI falls below, like 30, the reversal signal strengthens. So, it shows that the market was driven too low.
- Moving Averages
If the price hits a big moving average (like the 50-day or 200-day MA) and then makes a Hammer Doji, there’s another sign that the price is going to go up.
Limitations of the Hammer Doji Pattern
While the Hammer Doji is popular among traders for spotting potential reversals, it’s not foolproof. Before you base your decisions on this pattern alone, consider these crucial limitations:
- It Requires Confirmation to Be Reliable
A single Hammer Doji isn’t enough to act on. It’s essential to wait for a confirmation candle, like a strong bullish candle that follows, to validate the reversal signal.
- Not Reliable in Uneven or Volatility-Stricken Markets
Markets that are moving sideways or lack a clear trend can throw off the accuracy of this pattern. In such conditions, a Hammer Doji might appear to signal a reversal, but the price could just continue to drift aimlessly, leading to false entries.
- Low Volume May Weaken the Signal
If a Hammer Doji forms on very low trading volume, be cautious. It could simply be the result of random price movements rather than a meaningful shift in market sentiment. Stronger signals usually come when volume spikes along with the pattern.
Related Bullish Reversal Candlestick Patterns
Inverted Hammer
The Inverted Hammer resembles a reversed Hammer Doji. It is long-shadowed on the upper side, small on the bottom, and it follows the fall. Similarly to the Hammer Doji, it indicates a bullish reversal as well, however, confirmation is even more significant in its case.
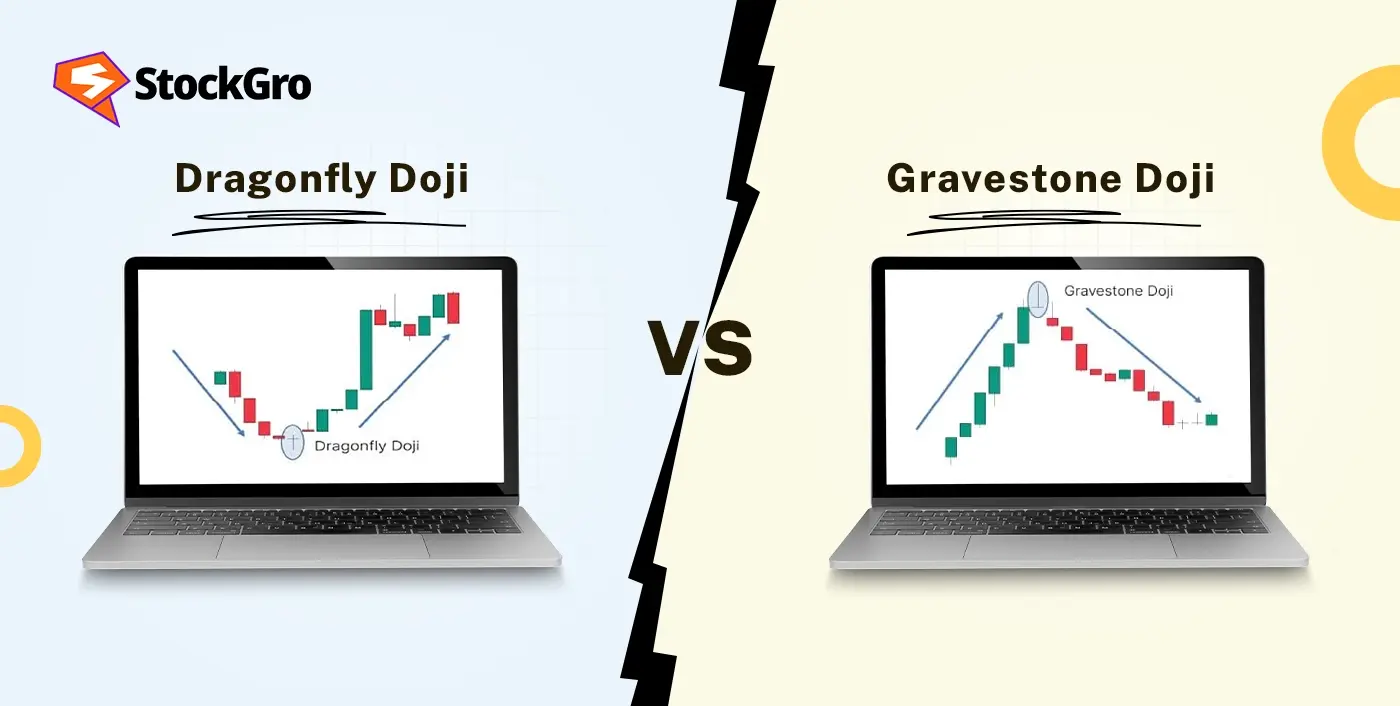
Dragonfly Doji
Hammer Dojis are identical to Dragonfly Dojis except for their thin or nonexistent bodies. It also depicts substantial force in the purchase of stock following an initial force of sellers on the price. It is an uncommon trend line, but it is strong when it appears following a steep decline.
Conclusion
The hammer Doji is an interesting candlestick formation that can be a helpful clue to prospective bullish corrections. But remember that this is not a warning to do anything immediately. Always watch out to see the general market trend, as well as combining it with confirmations such as volume, RSI, or moving averages. Once you become familiar with recognising and confirming this pattern, you can make it an essential weapon in your trading arsenal.
No matter whether you are a novice or someone seeking to perfect their technical analysis skills, learning patterns such as the Hammer Doji will provide you with that lift necessary to make better, more informed trades.
FAQs
A Hammer Doji is usually taken to be a bullish reversal pattern, more so when it happens following a down trend. It indicates that the effect of sellers was moving the prices downwards in the session; however, buyers came in force at the end of the day, creating a small real body with a long lower shadow.
Bullish sentiment is, however, not confirmed till a subsequent candle closes above. Therefore, a trader should act with confirmation since even the fact that the pattern shows an indication of a reversal should not be relied upon.
Depending on the timeframe, the Hammer Doji can be advanced in, but it’s more reliable when it is on a higher timeframe, such as the daily or the 4-hour chart. These durations present a better context and minimise noise, which is prevalent in smaller time frames. Remember, the smaller the timeframe, the greater the probability of false alerts, and thus, confirmation is more important.
A Hammer Doji can only be reliable when put in context and confirmed. It is not by itself a good enough signal to make a trade on. Nevertheless, when it appears around a significant support line and is preceded by a bullish candle with a robust volume indicator, its effectiveness improves.
It is also not infallible, particularly on sideways or low-volume markets, but when used on clearly trending markets with good confirmation, the Hammer Doji can provide a reasonably reliable indication of possible reversal.
The Hammer Doji can be applied in intraday trading, yes, but with additional caution. The intraday charts (such as 5 mins or 15 mins) can easily exhibit additional noise and fake signals, and combining the pattern with powerful confirmation, such as volume spikes or breakout candles, is essential.
In addition, support and resistance areas on longer timeframes can also be used to confirm the setup. Risk management is of utmost importance to intraday traders because market movements can easily invalidate the pattern within a short duration.