
Depending on a single indicator can lead to delayed decisions, causing traders to enter or exit positions at suboptimal points. Studies show that 70% of active traders use RSI and around 71% depend on MACD to analyse price momentum and generate signals on daily charts. The MACD RSI strategy explained combines MACD’s trend insights with RSI’s momentum signals, providing more timely entries and exits. Discover the setup, signals, and best timeframes in this blog.
What is a MACD Indicator?
The Moving Average Convergence Divergence, commonly known as MACD, was introduced by Gerald Appel in the 1970s and is widely used to track trends and momentum in technical analysis. It determines momentum and trend by analysing the gap between two moving averages, typically the 12-period and 26-period exponential averages. Trading signals are generated by comparing the MACD line with a signal line, which is usually a 9-period average derived from the MACD itself. A bullish signal occurs when the MACD crosses above the signal line, and bearish when it crosses below. The histogram, showing the distance between the lines, visually indicates trend strength. MACD helps identify both trend continuation and possible reversals but may lag during sideways markets.
What Is RSI Indicator?
The Relative Strength Index is a momentum indicator that shows the strength of recent price movements by converting them into a value that ranges from 0 to 100 scale. Created by J. Welles Wilder Jr., it helps identify overbought zones (above 70) and oversold zones (below 30), which may signal potential reversals.RSI values are derived by comparing average gains and losses over a commonly used period of 14 intervals. Values around 50 indicate neutral momentum, while extremes highlight momentum exhaustion. Traders use RSI to spot reversal zones and assess trend strength. However, during strong trends, RSI can stay overbought or oversold, potentially giving false signals if used alone.
MACD RSI Strategy
The MACD RSI strategy is a combined approach that uses both indicators to confirm trade signals, filter false alerts, and improve decision reliability. MACD provides insight into trend direction and momentum, while RSI focuses on potential reversal zones and overextension conditions.
When used together, traders look for situations where both indicators align such as MACD confirming the trend and RSI signaling momentum exhaustion or reversal to enter or exit trades. Combining the two helps balance trend following (MACD) with momentum extremes (RSI), resulting in fewer false positives and increased confidence in buy and sell signals.
Why Combine MACD and RSI?
Combining MACD and RSI provides a more comprehensive picture of market behavior than either indicator on its own. MACD excels at identifying the direction and strength of a trend, while RSI highlights when the market may be overextended or ready for a reversal.
MACD may generate trend‑related signals that lack clarity during sideways price action, while RSI can flag momentum extremes that don’t indicate a larger trend shift. By aligning MACD’s trend signals with RSI’s momentum context, traders reduce the risk of acting on misleading signals and improve the timing of entries and exits.
This combination helps filter out noise during weak trends and confirm signal validity during strong market movements. As a result, the MACD RSI strategy tends to produce higher‑quality setups in both trending and range‑bound conditions.
MACD RSI Buy Signal Strategy
In a MACD RSI strategy, buy signals generally occur when the following conditions are met:
- MACD crossover confirmation: A positive crossover occurs when the MACD rises above the signal line, hinting at strengthening bullish momentum.
- RSI oversold or rising: RSI is moving up from the oversold zone (typically below 30) or showing increasing strength above a trend‑specific threshold.
- Histogram strengthening: The MACD histogram bars begin to increase after a period of contraction, supporting strengthening momentum.
A classic example is when RSI moves out of oversold territory and the MACD confirms this by a bullish crossover. This alignment suggests both momentum and trend are moving in a favorable direction for a long position, offering a stronger setup than using either indicator alone.
MACD RSI Sell Signal Strategy
Sell signals in a MACD RSI strategy typically occur when:
- MACD bearish crossover: A negative crossover takes place when the MACD falls below the signal line, reflecting weakening momentum or a possible downtrend.
- RSI Overbought or declining: RSI enters or starts falling from overbought territory (above 70), indicating potential price exhaustion.
- Histogram weakening: Declining histogram bars help confirm loss of momentum or trend reversal.
When both indicators align, it suggests decreasing bullish pressure and a possible market reversal, signaling an opportunity to exit long trades or consider short positions. This dual‑confirmation approach helps avoid premature sell signals and captures more reliable reversal setups.
Let’s understand this better with an example from the chart below:
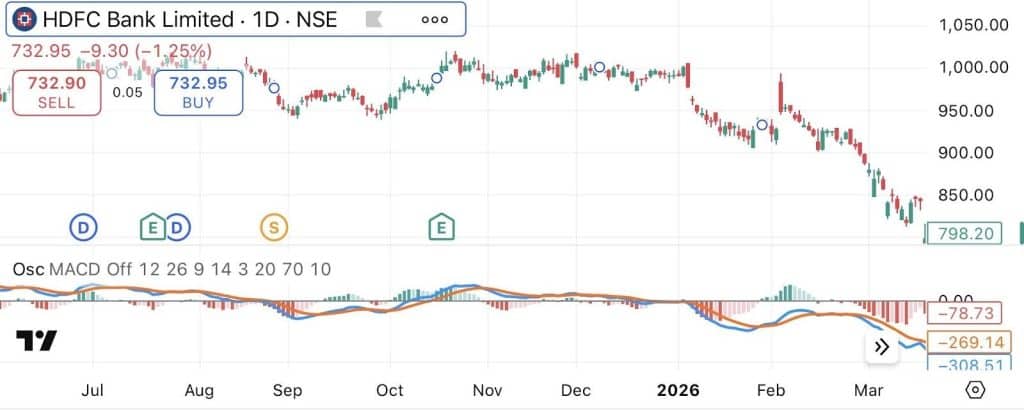
Looking at the late February to March 2026 period in the HDFC Bank Limited stock, we see a textbook execution of this sell strategy. As the price broke below the 900 level, the MACD line crossed sharply below the signal line while the histogram transitioned into deep red territory, signaling a massive loss in buyer support. This alignment served as a clear warning to exit positions before the price plummeted further toward the 732 level, illustrating how these combined signals filter out fake bounces and confirm a true trend reversal.
Best Timeframe for MACD RSI Strategy
The MACD RSI strategy can be applied across multiple timeframes, but effectiveness varies with trade style. The best timeframes for MACD RSI strategy include:
- Swing trading (daily/weekly): This is widely considered the optimal timeframe for the MACD-RSI combination. Higher timeframes reduce market noise and lagging issues inherent in MACD. Standard MACD settings include 12, 26, and 9, representing the fast EMA, slow EMA, and signal line respectively.
Standard settings (MACD 12, 26, 9 and RSI 14) are most effective here, with win rates often ranging between 55% and 73% in trending markets. - Intraday trading (1-hour/4-hour): These intraday trading timeframes are used to capture price reversals over a few days. Traders often adjust settings slightly (such as MACD 8, 17, 9) to gain sensitivity without over-exposing themselves to the volatility of smaller charts.
- Scalping (5-minute/15-minute): While possible, these timeframes generate the most false signals. Success at this level typically requires a multi-timeframe approach where the overall trend is confirmed on a much higher chart (like the 4-hour) before entering on the 5-minute.
MACD RSI Strategy for Intraday Trading
The MACD RSI strategy can be effectively applied in intraday trading to capture short-term price movements with better confirmation. It works by combining MACD crossovers for direction and RSI levels for entry timing, helping reduce false signals in fast-moving markets.
For intraday setups, shorter chart intervals like the 5-minute, 15-minute, or hourly charts are generally preferred. A buy opportunity may arise when the MACD shows a bullish crossover while the RSI moves upward from oversold territory (below 30). A sell signal forms when MACD turns bearish and RSI falls from overbought levels (above 70).
However, intraday trading involves higher noise and volatility, so signals may be less reliable compared to higher timeframes. Many traders use additional confirmation like support and resistance levels or volume to improve accuracy.
MACD RSI Strategy for Swing Trading
Swing traders focus on capturing multi‑day trend movements rather than quick intraday fluctuations. The MACD RSI strategy suits swing trading by filtering trend confirmation with momentum extremes. Traders typically use the standard MACD (12,26,9) and a 14‑period RSI on daily charts. In swing trading:
- Bullish setups rely on MACD crossovers confirmed by RSI rising from oversold zones.
- Bearish setups focus on RSI dropping from overbought zones with MACD bearish signals.
This strategy can help traders hold positions across short‑term trends and exit before exhaustion, improving risk‑adjusted outcomes. Adjusting RSI levels according to market volatility (e.g., 20–80 in choppy markets) may capture early shifts while managing false signals.
Best MACD and RSI Settings
Standard settings widely used in the MACD RSI strategy are:
- MACD settings: 12, 26, and 9, representing the fast EMA, slow EMA, and signal line respectively.
- RSI settings: 14‑period oscillator with 30 and 70 as oversold/overbought thresholds.
These settings are designed to strike a balance between sensitivity and filtering out market noise. In range‑bound or highly volatile markets, traders may adjust RSI to 20–80 or 40–60 thresholds depending on context, helping identify early reversals or avoid whipsaws.
Risk Management in MACD RSI Strategy
Risk management is essential for any technical strategy. With MACD RSI:
- Use stop-loss orders: Place stops below recent swing lows or above swing highs depending on trade direction.
- Position sizing: Avoid risking excessive capital on single trades; many traders risk 1–2% per trade.
- Avoid over‑optimisation: Tweaking settings to fit historical data may reduce real‑world performance.
- Confirm with price action: Confirm signals using price action tools like support/resistance levels or trading volume before taking a position.
Proper risk controls help avoid large drawdowns and protect capital during false signals or market noise.
MACD RSI Strategy: Pros and Cons
Pros:
- Combines trend and momentum for clearer signals.
- Helps minimise the chances of false signals compared to relying on just one.
- Adaptable to multiple timeframes and strategies.
Cons:
- MACD can lag in sideways markets.
- RSI signals may remain persistent in strong trends, causing premature exits.
- Requires careful tuning and risk discipline.
Using both indicators together improves signal quality but still demands confirmation and prudent risk practices.
MACD RSI Strategy vs Other Indicator Strategies
Different indicator strategies focus on different aspects of the market. The MACD RSI strategy stands out because it combines trend direction with momentum confirmation, unlike single-indicator approaches. The comparison below highlights how it differs from commonly used strategies.
| Basis of Comparison | MACD RSI strategy | MACD strategy | RSI strategy | Moving average strategy |
| Signal approach | Combines trend + momentum confirmation | Focuses on trend crossovers | Focuses on overbought/oversold levels | Based on price averages and crossovers |
| Accuracy of signals | More filtered due to dual confirmation | Can give delayed signals | Can give early but false signals | May lag in fast-moving markets |
| Market suitability | Works in both trending and range-bound conditions | Works best in trending markets | Works best in sideways markets | Works better in stable trends |
| Signal timing | Balanced between early and confirmed entries | Slightly delayed due to moving averages | Faster but less reliable in strong trends | Often delayed entries and exits |
| False signals | Reduced due to combination | Higher in sideways markets | Higher in trending markets | Common in choppy markets |
| Ease of use | Moderate (requires understanding both indicators) | Simple to use | Simple to use | Easy but requires patience |
Conclusion
The MACD RSI strategy explained provides a balanced way to identify buy and sell opportunities by combining trend and momentum analysis. By aligning MACD crossovers with RSI extremes, traders gain stronger confirmation for entry and exit points. While no strategy guarantees success, using MACD and RSI together alongside proper risk management can improve decision quality in both intraday and swing trading environments.
FAQs
Yes, the MACD RSI strategy can be profitable, especially in trending markets, though results depend on execution and market conditions.