Table of contents
Introduction
Stock prices can change a lot in a single day. Analysts closely monitor these changes, trying to figure out what they mean for future price movements. One important piece of information they look at is called “today’s low.”
For day traders and technical analysts, knowing today’s low is crucial. It helps them spot trends and make quick decisions to earn profits. In this blog, we’ll dive into the meaning of today’s low, how it’s used, and explore some technical analysis techniques to help you trade smarter.
What is today’s low?
Today’s low refers to the lowest price a stock trades at during a single trading day. Predicting exactly when this low point will occur is challenging because it depends on many factors like market sentiment, economic news, and investor behavior. However, knowing today’s low is crucial for traders and technical analysts who want to trade better.
Technical analysts study stock price movements to find patterns and clues about where prices might go next. Today’s low is one of those clues they use. Analysts can spot trends and predict future price movements by comparing today’s low stocks to the previous day’s high and low.
By paying attention to today’s low and other key indicators, traders can decide when to buy or sell stocks to maximize their profits. They look for patterns like sudden drops or spikes in prices, which help them figure out the best times to make a trade.
Today’s low vs 52-week low stocks
When you’re checking a stock’s details, you can find today’s low in the “Range” section of the stock. This number represents the lowest price the stock has hit during the current trading day. It’s just one of the many pieces of information you’ll find on a stock quote.
However, for a broader view of how a company’s stock has been performing over a longer period, analysts look at the 52-week low stocks. These numbers show the lowest prices the stock has reached over the past 52-week period. The 52-week low offers a more comprehensive perspective on how well or poorly a stock has been doing.
While today’s low only gives you information about the lowest price the stock has hit on the current trading day, the 52-week low tells you the lowest price the stock has reached in the previous 52 weeks. For example, As of May 4th, 2024, the Nifty’s today’s low is at 22,348.05, whereas Nifty’s 52-week low stands at 18,055.45.
By comparing today’s low with the 52-week low stocks, investors can get a better sense of how a stock is currently performing considering its recent past.
How do traders use today’s low?
- Entry Points
Traders see today’s low as a crucial opportunity to enter the market at a favourable price. They aim to open positions when a stock’s price hits today’s low but shows signs of potential upward movement, indicating a possible reversal in its trend.
However, deciding the best entry point involves more than just reacting to today’s low—it requires following well-researched trading strategies that consider various technical and fundamental factors. By using today’s low as part of their strategy, traders aim to minimize risk and avoid emotional decision-making.
Value investors see today’s low as an opportunity to identify undervalued stocks with growth potential. They look for stocks trading at prices below their intrinsic value. Today’s low provides value investors with a starting point to assess if a stock is selling at a discount compared to its future potential. This fits perfectly with the value investing strategy of finding bargains in the market and holding onto them until their true value is realized, leading to profitable returns.
Stop-loss orders are like safety nets for investors that activate when a security’s price hits a certain level. This level is often informed by today’s low, serving as a reference point for setting the stop-loss order. By using today’s low as a guide, investors can protect themselves from significant losses if the security’s price unexpectedly drops below that level.
- Confirmation of Trends
Traders use today’s low to confirm trends in the market. If a stock’s price hits today’s low and remains below it, it may confirm a downward trend in the stock’s price. On the other hand, if the stock’s price bounces back after reaching today’s low, it could signal a reversal or confirmation of an upward trend.
- Contrarian Opportunities
Contrarian investors see today’s low as an opportunity to go against the crowd and capitalize on market sentiment. When others are selling and driving prices down to today’s low, contrarians may see it as a chance to buy undervalued assets that others are overlooking. Similarly, when everyone is buying and pushing prices up, contrarians may consider selling to lock in profits or avoid overvalued stocks.
Technical analysis of today’s lows
Technical analysis involves using past market data to forecast future price movements. Day traders look at today’s low and high to spot gaps, and sudden price jumps to trade risk-free.
- Common technical indicators of today’s low
Traders can indicate today’s low on a stock chart by simply looking at the lowest price the stock has traded at during the current trading session. Most online stock trading platforms provide real-time charts with markers for today’s high and low prices.
- Chart patterns of today’s low
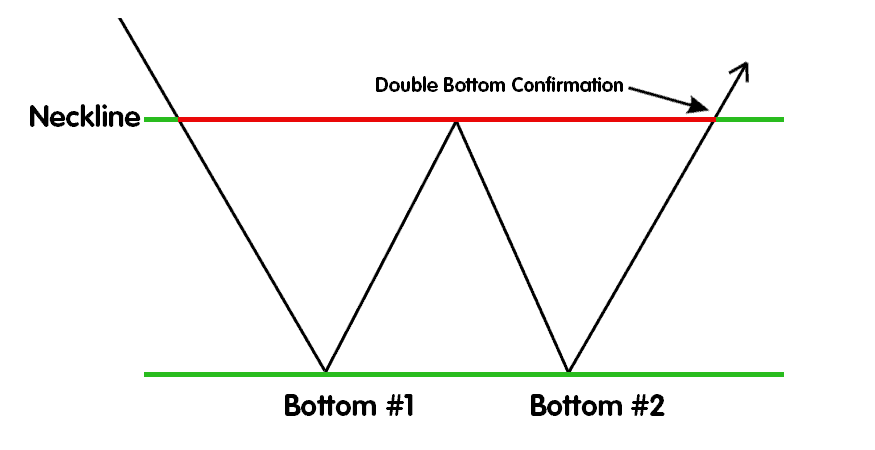
- Double Bottom- This pattern forms when a stock’s price reaches a low, bounces back up, and then declines again to approximately the same level as the previous low before rallying. Today’s low could represent the second bottom of the pattern, indicating a potential reversal to the upside.
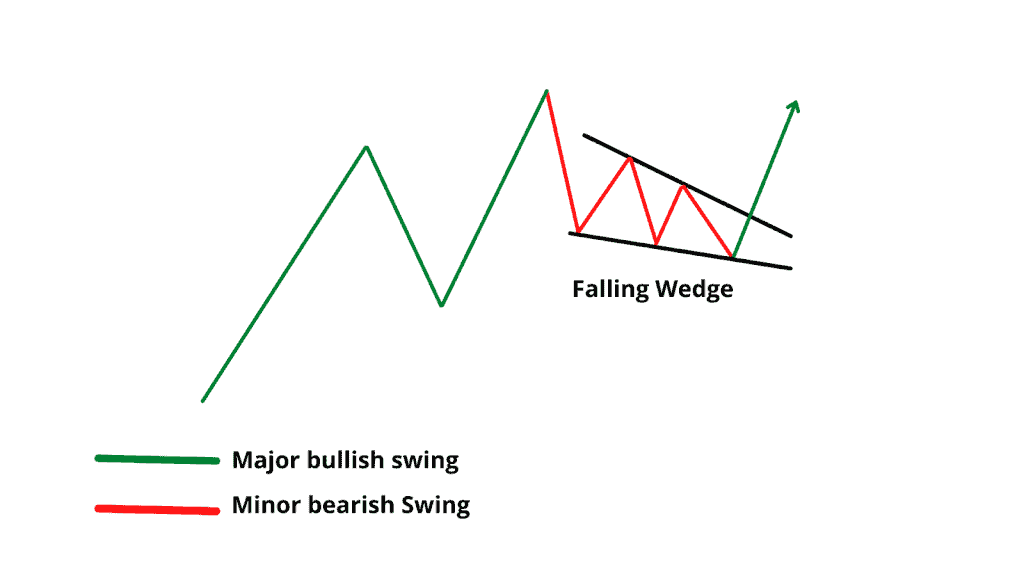
- Falling Wedge– A falling wedge pattern is characterized by a narrowing price range between two downward-sloping trendlines. Today’s low may occur within the wedge pattern, suggesting a potential reversal to the upside as the stock approaches support.
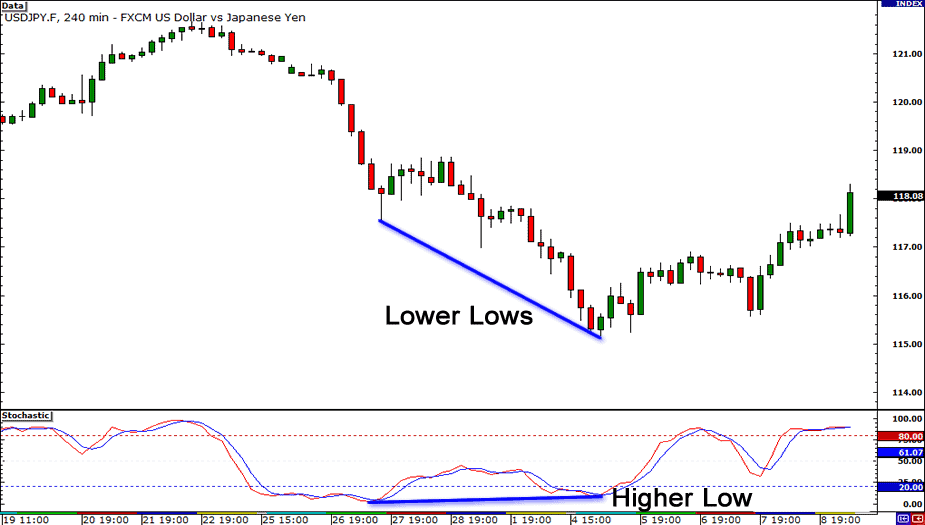
- Bullish Divergence- Bullish divergence occurs when the stock’s price makes a new low, but the indicator (such as the Relative Strength Index or RSI) fails to confirm the new low. Today’s low could signal a potential reversal as the divergence suggests a weakening downward momentum.
Conclusion
To conclude, today’s low refers to the lowest price at which a stock trades during a single trading day. Understanding it is essential for stock trading. Whether it’s identifying entry points, confirming trends, or utilizing technical analysis, today’s low plays a significant role in guiding trading decisions.
Incorporating today’s low into analysis, traders can better manage risk, and identify potential opportunities, to achieve their investment goals.
FAQ’s
Today’s low refers to the lowest price at which a stock trades during a single trading day.
Today’s high refers to the highest price at which a stock trades during a single trading day.
To find “Today’s Low” for a specific stock, you can check the real-time range of the stock on any financial websites, trading platforms, or stock market apps.
Investors can effectively incorporate today’s low into their trading strategy by using it as a reference point for setting stop-loss orders, identifying potential entry or exit points, and confirming trends.
Both of them are different as today’s low represents the lowest price of the day, while the 52-week low is the lowest price the stock has reached over the past 52 weeks or one year.